How to Use Fibonacci Retracement in Forex Trading
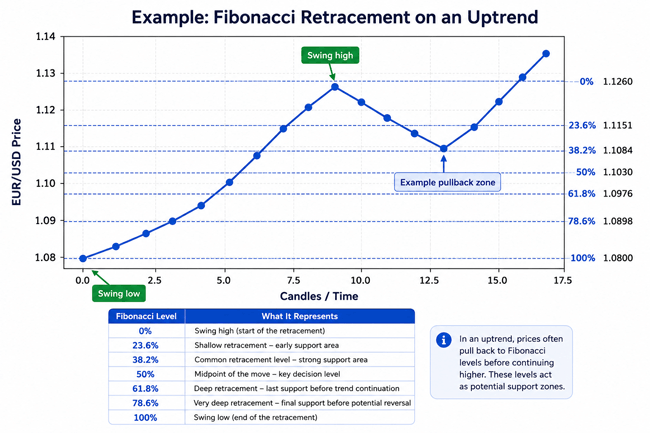
Fibonacci retracement in forex trading is a chart tool that helps traders estimate where a price pullback may slow down, pause, or reverse. It does not predict the future, and it is not a magic signal. A better way to think about it is this: Fibonacci retracement gives you a clean map of possible decision zones after a currency pair has already made a strong move. When price reaches one of those zones, you then look for confirmation before planning a trade.
This guide explains Fibonacci retracement in simple language for beginners. You will learn what it is, why forex traders use it, how to draw it, what levels matter most, how to avoid common mistakes, and how to use it with risk management instead of gambling on lines.
1. What Is Fibonacci Retracement in Forex Trading?
Fibonacci retracement is a technical analysis tool that divides a price move into percentage levels. The most commonly watched retracement levels are 23.6%, 38.2%, 50%, 61.8%, and 78.6%. Traders use these levels to estimate where a pullback may find support in an uptrend or resistance in a downtrend.
In simple words, imagine EUR/USD rises strongly from 1.0800 to 1.1200. Many traders do not want to buy at the very top, so they wait for a pullback. Fibonacci retracement helps them mark possible areas where that pullback might become attractive again. The tool answers a practical question: if the trend is still healthy, where might buyers step back in?
The word retracement matters. It means a temporary move against the main trend. In an uptrend, a retracement is a pullback. In a downtrend, a retracement is a bounce. A retracement is not the same as a full reversal, although beginners often confuse the two.
2.Why Do Forex Traders Use Fibonacci Retracement?
Forex traders like Fibonacci retracement because currency prices often move in waves rather than straight lines. A pair may trend upward, pause, pull back, and then continue higher. Fibonacci levels give traders a structured way to plan instead of chasing candles emotionally.
Experienced traders usually do not use Fibonacci alone. They use it as a location tool. The Fib level tells them where to pay attention; price action, support and resistance, session timing, trend strength, and risk-reward decide whether the trade is worth taking.
The real value of Fibonacci retracement is discipline. It can stop a beginner from buying after a huge candle just because the market looks exciting. It can also stop a trader from entering blindly, because a good Fibonacci setup still needs confirmation and a defined stop-loss.
3. The Main Fibonacci Levels Explained Simply
23.6% is a shallow pullback. It often appears in very strong trends where buyers or sellers do not give much ground. It can be useful, but beginners should be careful because entries here may have wider stop-loss distances.
38.2% is a moderate pullback. Many trend-following traders watch this level because it may show that the trend is strong but not overheated. In fast-moving forex markets, this is often one of the first serious areas of interest.
50% is not an official Fibonacci ratio, but traders use it because markets often retrace about half of a strong move. It is popular because it is easy to understand: price gives back half of the move and then traders decide whether the trend still has strength.
61.8% is often called the golden ratio area. It is one of the most watched Fibonacci retracement levels. A bounce from this zone can be meaningful, but if price breaks through it strongly, the original trend may be weakening.
78.6% is a deep retracement. It can offer tight-risk opportunities, but it also carries a higher chance that the original trend is failing. Beginners should treat it as an advanced zone, not an automatic buy or sell level.
Example Fibonacci Retracement Chart
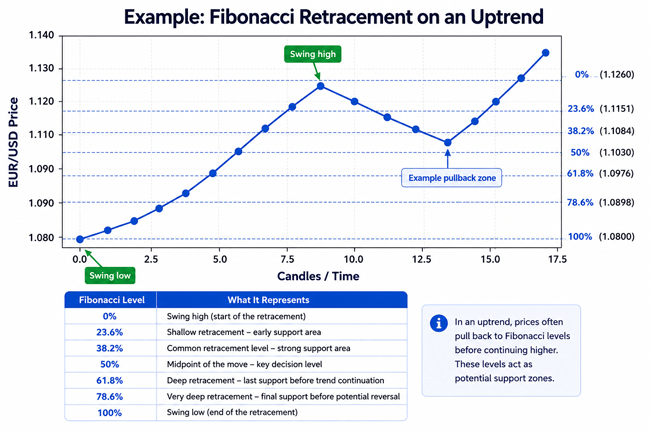
Example Fibonacci retracement drawn from swing low to swing high on an uptrend. The pullback area between 38.2% and 61.8% is where many traders start looking for confirmation.
4. How Fibonacci Retracement Works on a Forex Chart
The tool works by measuring a completed price swing. In an uptrend, you draw from the swing low to the swing high. In a downtrend, you draw from the swing high to the swing low. The platform then plots horizontal levels between those two points.
For a bullish setup, traders wait for price to pull back down into a Fibonacci zone. For a bearish setup, traders wait for price to bounce up into a Fibonacci zone. In both cases, the trader is trying to join the bigger move after a temporary correction.
The biggest beginner mistake is drawing Fibonacci on every tiny move. If the swing is not obvious, the levels are usually not helpful. A useful swing should be visible without zooming in too much. If five traders would choose five completely different swing points, the setup is probably too messy.
5. Step-by-Step: How to Draw Fibonacci Retracement Correctly
Step 1: Find a clear trend. Do not start with Fibonacci. Start with market structure. Are highs and lows rising, falling, or moving sideways? Fibonacci retracement works best when there is a clear directional move.
Step 2: Identify the swing low and swing high. In an uptrend, select the lowest point before the move started and the highest point before the pullback began. In a downtrend, select the highest point before the drop started and the lowest point before the bounce began.
Step 3: Draw in the correct direction. Uptrend: low to high. Downtrend: high to low. This sounds simple, but it is one of the most common beginner errors.
Step 4: Watch the reaction, not just the line. A Fibonacci level only becomes useful when price reacts around it. Look for rejection candles, a break of a small counter-trend line, a shift in momentum, or support/resistance lining up with the same area.
Step 5: Plan the trade before entry. Decide your entry trigger, stop-loss, target, position size, and what would prove your idea wrong. Pro-style trading is not about finding a perfect level; it is about knowing exactly what you will do before money is at risk.
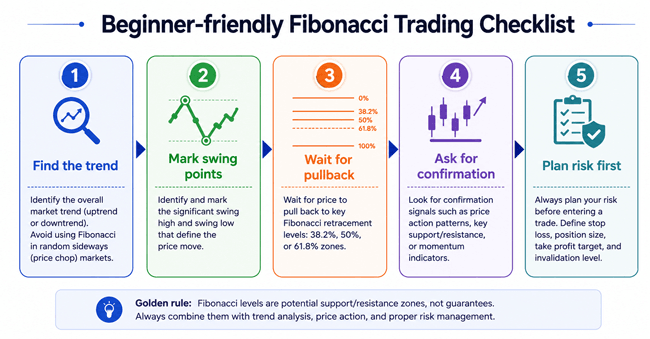
A simple workflow for using Fibonacci retracement like a trading plan, not a prediction tool.
6. Practical Example: EUR/USD Fibonacci Retracement Setup
Assume EUR/USD rallies from 1.0800 to 1.1200. That is a 400-pip upward move. A beginner may want to buy immediately after seeing the rally, but a patient trader waits for a pullback.
Using the Fibonacci tool, draw from 1.0800 at the swing low to 1.1200 at the swing high. The approximate retracement levels would be: 23.6% near 1.1106, 38.2% near 1.1047, 50% near 1.1000, 61.8% near 1.0953, and 78.6% near 1.0886.
Now suppose price pulls back to the 50% level around 1.1000. That number is also a major round number, and previous resistance on the chart has turned into possible support. A trader might wait for a bullish rejection candle or a break above a small pullback trendline before entering.
A sample plan could look like this: enter only after bullish confirmation near 1.1000, place the stop-loss below the 61.8% zone or below the latest swing low, target the previous high near 1.1200 first, and consider a second target only if momentum remains strong.
Notice what this example does not do. It does not say buy at 50% automatically. It does not promise profit. It uses Fibonacci as part of a full plan that includes context, confirmation, invalidation, and risk control.
7. Quick Reference: Fibonacci Levels and Beginner Meaning
| Level | What it usually means | Best use | Beginner caution |
|---|---|---|---|
| 23.6% | Very shallow pullback | Strong trends and momentum continuation | Can be too early; stop may be far away |
| 38.2% | Healthy pullback | Trend continuation entries | Needs confirmation |
| 50% | Halfway retracement | Round-number and structure confluence | Not a true Fibonacci ratio, but widely watched |
| 61.8% | Deep but common pullback | Golden-ratio area with strong confluence | Break below/above may weaken the trend idea |
| 78.6% | Very deep pullback | Advanced reversal or continuation setups | Higher risk of a full reversal |
8. How Professional Traders Actually Use Fibonacci Retracement
Professional traders usually care less about the exact number and more about the zone. They know price may miss a level by a few pips or overshoot it before reacting. That is why many traders mark a Fibonacci zone between two nearby levels instead of treating one line as perfect.
They also use higher timeframes for context. A 61.8% retracement on the 4-hour chart usually matters more than a 61.8% level on a 1-minute chart. Lower timeframes can help with entry timing, but the main idea should come from a chart that shows meaningful structure.
Another practical habit is checking whether many traders may be watching the same area. If a Fib level overlaps with old support, a round number, a trendline, or a moving average, it becomes more interesting. This is called confluence. The more independent reasons pointing to the same area, the more seriously traders may watch it.
A pro-style mindset is also comfortable with no trade. If price reaches a Fib level but gives no confirmation, the trader simply waits. Missing a trade is cheaper than forcing a weak setup.
9. Best Tools to Combine With Fibonacci Retracement
- Support and resistance: This is the most important companion. A Fib level that lines up with previous support or resistance is stronger than a Fib level floating in empty space.
- Trendlines and channels: If a pullback touches a Fibonacci level and a trendline at the same time, it may show that the trend structure is still respected.
- Candlestick confirmation: Pin bars, engulfing candles, inside-bar breaks, or strong rejection wicks can help confirm that traders are defending a zone. Candles should support your plan, not replace it.
- Moving averages: A 50-period or 200-period moving average near a Fib zone can add context. It does not guarantee a bounce, but it tells you that other technical traders may also be watching that area.
- Momentum indicators: RSI or MACD can help show whether momentum is slowing or returning. Use indicators as supporting evidence, not as a reason to ignore price structure.
10. Risk Management: The Part Beginners Must Not Skip
Fibonacci trading becomes dangerous when a trader thinks the level itself protects them. It does not. A stop-loss, position size, and risk limit are what protect the trading account.
A simple beginner rule is to risk only a small fixed percentage of the account on any one trade. Many cautious traders use 1% or less. The exact number depends on the trader, but the principle is universal: one losing trade should never damage your ability to keep learning.
Always know where the setup is invalidated. In an uptrend Fib trade, the stop often goes below the swing low, below the 61.8%/78.6% zone, or below a structure level. In a downtrend, it often goes above the swing high or above the key resistance zone.
Be careful with leverage. Forex brokers may offer high leverage, but high leverage can turn a normal pullback into a large account loss. A regulated forex broker and transparent broker fees matter, but no broker feature replaces personal risk discipline.
11. Common Fibonacci Retracement Mistakes
Mistake 1: Drawing from the wrong swing points. If the swing high and swing low are random, every level becomes random too.
Mistake 2: Using Fibonacci in choppy sideways markets. Retracement tools work best after a clear impulse move. In a range, support and resistance are usually more useful.
Mistake 3: Entering just because price touched 61.8%. A touch is not confirmation. Wait for a reaction or a planned trigger.
Mistake 4: Moving the stop-loss because you believe the Fib level must work. If your invalidation point is hit, the market is telling you the idea may be wrong.
Mistake 5: Ignoring news. Major economic releases can smash through technical levels. Before trading major currency pairs, check the economic calendar for central bank decisions, inflation data, employment reports, and high-impact news.
12. Fibonacci Retracement vs Other Forex Tools
| Tool | Best for | Strength | Weakness |
|---|---|---|---|
| Fibonacci retracement | Estimating pullback zones | Clear structure after a strong move | Subjective swing selection |
| Support and resistance | Finding historical reaction areas | Easy to understand and widely used | Can become crowded or messy |
| Moving averages | Showing trend direction | Simple visual trend filter | Lags behind price |
| RSI/MACD | Reading momentum | Can spot momentum shifts | Can give false signals in strong trends |
13. A Beginner Practice Plan for the Next 30 Days
Week 1: Do not trade. Open a demo charting platform and practice drawing Fibonacci retracement on obvious daily and 4-hour swings. Save screenshots and write down why you chose each swing.
Week 2: Add support and resistance. Only mark Fib levels that overlap with structure. Ignore all other levels. This teaches you to focus on quality instead of clutter.
Week 3: Add confirmation. Review what happened when price touched a Fib zone. Did it reject, consolidate, break through, or reverse? Start noticing behavior instead of guessing.
Week 4: Build sample trade plans. For each setup, write entry, stop-loss, target, and risk-reward before checking what happened later. This builds the habit of planning before emotion enters.
14. Honest Verdict: Is Fibonacci Retracement Worth Learning?
Yes, Fibonacci retracement is worth learning if you treat it as a planning tool, not a prediction machine. It is simple enough for beginners, but it becomes useful only when combined with market structure, confirmation, and risk management.
The best forex traders do not win because they found a secret Fibonacci level. They improve because they wait for better locations, manage risk, review their trades, and avoid emotional decisions. Fibonacci retracement can support that process, but it cannot replace it.
If you are new, your first goal should not be to make money quickly. Your first goal should be to learn how price moves, how pullbacks behave, how leverage affects risk, and how to protect your account while gaining experience.
■ Frequently Asked Questions
1. What is the best Fibonacci retracement level for forex trading?
There is no single best level. Many traders watch 38.2%, 50%, and 61.8%, but the best area is usually the one that also lines up with support/resistance, trend structure, or another form of confirmation.
2. Can beginners use Fibonacci retracement?
Yes. Beginners can use it, but they should first learn trend direction, swing highs and lows, support and resistance, and basic risk management.
3. Does Fibonacci retracement really work?
It can be useful because many traders watch similar levels, but it does not work all the time. It should be tested, combined with confirmation, and used with a stop-loss.
4. Should I use Fibonacci retracement for scalping?
It can be used on lower timeframes, but scalping is faster and more stressful. Beginners usually learn better on higher timeframes where signals are less noisy.
5. Is Fibonacci retracement better than support and resistance?
No. It is different. Support and resistance often matter more because they show where price reacted before. Fibonacci becomes stronger when it aligns with those areas.
6. What is the biggest Fibonacci trading mistake?
The biggest mistake is treating a Fibonacci level as a guaranteed reversal point. A level is only a possible area of interest; the trader still needs confirmation and risk control.
Reader Advice: This article is provided for educational and informational purposes only and should not be considered financial, investment, or trading advice. Forex trading involves risk. Before making any trading decisions, take the time to study the forex market thoroughly, understand the risks, and evaluate whether trading is appropriate for your financial situation and experience. Always make informed decisions based on your own research, and consider seeking guidance from a qualified financial professional when needed.