How to Use Moving Averages in Forex Trading: Strategies, Examples & Beginner Tips
1. What is a moving average in forex trading?
A moving average is a line that shows the average price of a currency pair over a chosen number of candles. Instead of staring at every small jump and drop, the moving average smooths the price so a beginner can see the bigger direction more clearly.
For example, a 20-period moving average on a 1-hour EUR/USD chart shows the average of the last 20 hourly closing prices. When a new candle closes, the oldest price drops out and the newest price joins the calculation. That is why it is called “moving.”
In simple words: price is the noisy conversation; the moving average is the calmer voice telling you whether the market has recently been leaning up, down, or sideways.
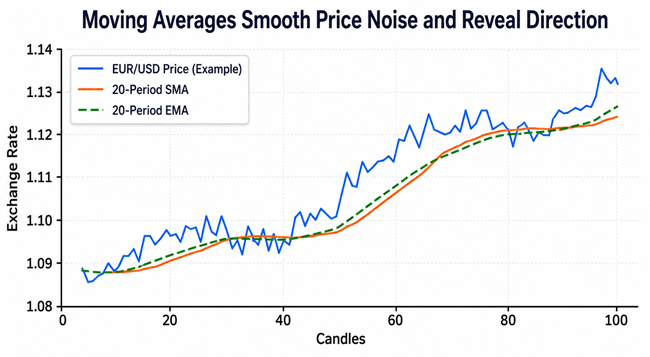
Figure 1: Price compared with 20 SMA and 20 EMA.
2. How moving averages work, explained like you are new
Imagine you write down the last 10 closing prices of GBP/USD and calculate their average. That number becomes one dot on the chart. On the next candle, you remove the oldest closing price, add the newest one, and calculate again. When all the dots are connected, you get a moving average line.
The shorter the period, the faster the line reacts. A 10-period moving average follows price closely, but it can also give more false signals. A 200-period moving average reacts slowly, but many traders use it to understand the bigger trend.
| Moving average length | What it usually shows | Beginner-friendly use |
|---|---|---|
| 9 or 10 MA | Very short-term momentum; reacts quickly. | Useful for active traders, but can be noisy. Beginners should avoid relying on it alone. |
| 20 MA | Short-term trend and recent price pressure. | Good for seeing whether price is respecting a short-term direction. |
| 50 MA | Medium-term trend. | Often used for pullbacks and trend confirmation. |
| 100 MA | Broader market direction. | Useful for filtering trades when the market is not clearly trending. |
| 200 MA | Long-term trend or major reference area. | Often used as a "big picture" line on higher timeframes. |
3. SMA vs EMA: which moving average should a forex beginner use?
The two most common types are the simple moving average (SMA) and the exponential moving average (EMA). Both are useful, but they behave differently.
| Type | Meaning | Strength | Weakness | Best beginner use |
|---|---|---|---|---|
| SMA | Simple Moving Average: gives equal weight to each price in the period. | Cleaner and smoother; helpful for big-picture direction. | Slower to react when price changes quickly. | Trend filter, support/resistance area, higher-timeframe analysis. |
| EMA | Exponential Moving Average: gives more weight to recent prices. | Reacts faster to new momentum. | Can trigger more false signals in choppy markets. | Pullback entries, crossover systems, active trend following. |
There is no “best moving average for forex” that works all the time. The better question is: what problem are you trying to solve? If you want a calm trend filter, use a 100 or 200 SMA/EMA. If you want a faster entry guide, use a 10, 20, or 50 EMA. Many experienced traders keep it simple: one fast average, one slow average, and clear risk rules.
■ practical ways beginners can use moving averages in forex
1. Use a moving average to identify trend direction
The most basic use is trend direction. If price is above a rising moving average, the market is often in an uptrend. If price is below a falling moving average, the market is often in a downtrend. If price keeps crossing back and forth, the market may be ranging and moving-average signals become weaker.
Example: Suppose EUR/USD is on the 4-hour chart, and price is above the 50 EMA while the 50 EMA is sloping upward. A beginner may decide to look only for buy setups until the condition changes. This does not guarantee profit, but it prevents the common mistake of selling repeatedly into a strong uptrend.
2. Use moving averages as a trend filter
A trend filter is a rule that helps you decide which direction you are allowed to trade. It keeps your strategy cleaner because you are not reacting to every candle.
Example rule: “On GBP/USD, I only look for buys when price is above the 200 EMA on the 1-hour chart. I only look for sells when price is below the 200 EMA. If price is crossing the 200 EMA repeatedly, I do not trade that pair.”
This type of rule is simple, but it is powerful because it reduces overtrading. Many beginner losses come not from one bad indicator, but from taking too many random trades without a market condition filter.
3. Use moving average pullbacks instead of chasing price
A common beginner mistake is buying after a large green candle because the trader fears missing the move. Often, price pulls back, the trader panics, and exits at a loss. A moving average can help create patience.
In an uptrend, traders often wait for price to pull back toward the 20 EMA or 50 EMA, then look for confirmation such as a bullish candle, rejection wick, previous support, or higher low. In a downtrend, they wait for price to pull back toward the average and then look for selling pressure.
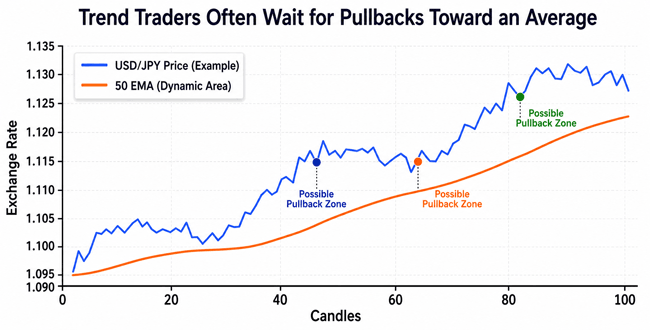
Figure 2: Pullback zones near a 50 EMA in a trending market. This teaches patience rather than chasing candles.
4. Use moving average crossovers carefully
A crossover happens when a faster moving average crosses a slower moving average. For example, a 10 EMA crossing above a 30 EMA may suggest bullish momentum. A 10 EMA crossing below a 30 EMA may suggest bearish momentum.
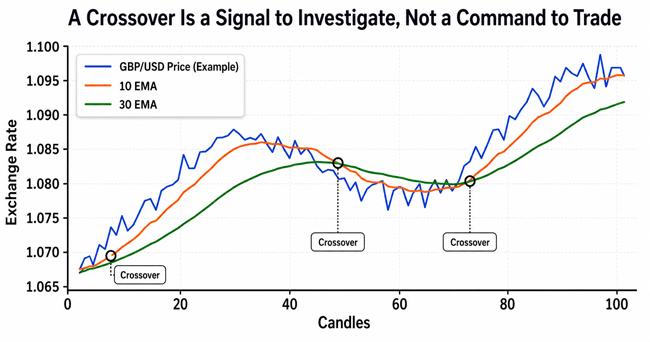
Figure 3: Crossover signals can help identify momentum changes, but they need market context.
The problem is that crossovers are late. By the time the lines cross, part of the move may already be finished. In sideways markets, crossovers can also appear again and again, causing losses. A crossover should be treated as a reason to investigate, not as an automatic buy or sell instruction.
Better beginner rule: take crossover signals only when the higher timeframe supports the same direction and the market is not trapped in a tight range.
5. Use moving averages as dynamic support and resistance
In a clean trend, price often returns to a moving average and then continues in the trend direction. Traders call this dynamic support or dynamic resistance because the area moves with price.
This is not magic. Many traders watch similar averages, so price can react around them. But price can also cut through them easily during news, low liquidity, or trend exhaustion. Treat the moving average as an area of interest, not a wall.
■ A simple moving average strategy for beginners
Here is a practical framework a beginner can test on a demo trading account. It is not a promise of profit. It is a structured way to learn how moving averages behave.
| Step | Rule | Why it matters |
|---|---|---|
| 1. Market selection | Choose one or two major pairs such as EUR/USD or GBP/USD while learning. | Major pairs often have tighter spreads and more consistent liquidity than exotic pairs. |
| 2. Timeframe | Use the 1-hour or 4-hour chart first. | Very low timeframes can be noisy and emotionally stressful for beginners. |
| 3. Trend filter | Add a 200 EMA. Look for buys above it and sells below it. | This keeps you aligned with the broader direction. |
| 4. Entry area | Add a 20 EMA or 50 EMA. Wait for a pullback toward it. | This reduces chasing and gives a cleaner trade location. |
| 5. Confirmation | Look for a rejection candle, higher low/lower high, or break of a small structure. | Confirmation helps avoid entering just because price touched a line. |
| 6. Stop loss | Place the stop beyond the recent swing high/low, not exactly on the moving average. | Stops placed too tightly often get hit by normal market noise. |
| 7. Exit plan | Use a realistic risk-to-reward target, trailing stop, or opposite signal. | A trade without an exit plan becomes emotional. |
| 8. Journal | Write down why you entered, where you exited, and what you learned. | A trading journal turns random experience into usable feedback. |
Example trade walkthrough
Imagine EUR/USD on the 4-hour chart. Price is above the 200 EMA, and the 200 EMA is rising. This means the broader trend is bullish. Price then pulls back toward the 50 EMA after a strong upward move. Instead of buying immediately, the trader waits for confirmation.
A bullish rejection candle forms near the 50 EMA and near a previous support area. The trader enters after the candle closes, places the stop loss below the recent swing low, and targets the previous high or a 1:2 risk-to-reward level. If the stop is 35 pips, the target may be around 70 pips. If spread and volatility make the setup unattractive, the trader skips it.
The important lesson is not the exact pair or pip number. The lesson is the sequence: trend first, pullback second, confirmation third, risk management always.
■ What every beginner should know before using moving averages
| Beginner question | Honest answer |
|---|---|
| Do moving averages predict price? | No. They are based on past prices. They help organize information, but they cannot know the future. |
| Can I trade only with moving averages? | You can test simple systems, but using price structure, support/resistance, volatility, news awareness, and risk control usually gives better context. |
| Which pair works best? | Moving averages can work on any liquid pair, but beginners often learn better on major pairs because spreads are usually lower. |
| Which timeframe is best? | The 1-hour and 4-hour charts are often easier for beginners than the 1-minute or 5-minute charts. |
| How many moving averages should I use? | Two or three are enough. Too many lines create confusion and make every trade look both right and wrong. |
| Why did my moving average signal fail? | Because markets range, news changes volatility, spreads widen, and indicators lag. Failed signals are normal. |
4. Popular moving average settings in forex trading
You will see many settings online: 9 EMA, 20 EMA, 50 EMA, 100 SMA, 200 EMA, 21/50 crossover, 50/200 crossover, and more. The setting matters less than consistency. A trader who changes settings after every loss never learns whether the method actually has an edge.
| Setting | Common use | Best for | Main caution |
|---|---|---|---|
| 9 EMA + 21 EMA | Fast trend and momentum reading. | Short-term traders. | More false signals in choppy markets. |
| 20 EMA | Short-term pullbacks and trend pressure. | Day trading and swing trading. | Can be too sensitive during news. |
| 50 EMA | Medium-term trend and pullbacks. | Beginner trend-following setups. | May lag during sharp reversals. |
| 100 SMA/EMA | Broader filter. | Reducing noise. | May keep you out of early moves. |
| 200 SMA/EMA | Major trend filter. | Big-picture direction. | Not useful as an exact entry line. |
| 50/200 crossover | Longer-term trend shift. | Swing and position trading. | Can be very late. |
5. When moving averages work best, and when they fail
Moving averages usually work best in trending markets. When price is making higher highs and higher lows, a rising average can help traders stay with the move. When price is making lower lows and lower highs, a falling average can help traders avoid buying too early.
They usually fail or become frustrating in sideways markets. If price is flat and crossing the average repeatedly, the average is not giving clear information. This is where beginners often blame the indicator, but the real issue is market condition. A trend tool performs poorly in a range.
| Market condition | What the moving average shows | Better beginner action |
|---|---|---|
| Strong uptrend | Price stays above rising averages. | Look for buy pullbacks, avoid selling against the trend. |
| Strong downtrend | Price stays below falling averages. | Look for sell pullbacks, avoid buying too early. |
| Sideways range | Price crosses the average repeatedly. | Avoid crossover trades; use range tools or wait. |
| News spike | Price moves far away from averages quickly. | Do not chase. Let spreads and volatility calm down. |
| Trend exhaustion | Price separates too far from the average, then stalls. | Be careful entering late; wait for a pullback or new structure. |
6. Risk management: the part most beginners ignore
The moving average is only a tool for reading direction. It does not control how much money you can lose. In forex, leverage can make small price movements create large gains or large losses. That is why risk management is more important than finding the “perfect” moving average setting.
A practical beginner rule is to risk only a small percentage of account equity on one trade, use a stop loss, and avoid increasing lot size after a loss out of frustration. Many experienced traders also avoid trading during major news releases unless their strategy is built for high volatility.
Simple risk checklist before every trade:
- Do I know exactly where my stop loss is before entering?
- Is my position size small enough that one loss will not damage my account or emotions?
- Is the spread reasonable for the pair and timeframe?
- Am I trading with the trend or knowingly taking a countertrend trade?
- Is there major news soon that could create slippage?
- Would I still take this trade if I had not just lost the previous one?
■ Common mistakes traders make with moving averages
1. Using too many moving averages
A chart with 7 or 10 moving averages may look professional, but it often creates confusion. Beginners need fewer tools and clearer rules.
2. Treating every crossover as a signal
A crossover in a sideways market can be a trap. Always check trend, range, support/resistance, and higher timeframe context.
3. Changing settings after every loss
Losses happen even in good systems. If you change from 20 EMA to 21 EMA to 34 EMA after every losing trade, you never collect reliable feedback.
4. Ignoring spread and session timing
A setup that looks good on the chart may be poor if the spread is wide or liquidity is thin. This matters especially on lower timeframes.
5. Entering before the candle closes
A moving average signal can appear during a candle and disappear before the close. Waiting for the candle close often reduces fake signals.
6. Trading without a journal
Without notes, beginners repeat the same mistake and call it bad luck. A journal shows whether the issue is entry timing, market condition, stop placement, or emotions.
■ Experience-based tips that make moving averages more useful
- Start with one pair, one timeframe, and two moving averages. Learn behavior before adding more tools.
- Use moving averages for context first, entries second. Direction matters more than the line itself.
- Avoid trading when price is tangled around the average. Clean separation usually gives cleaner information.
- Backtest by manually scrolling through old charts. Do not only look at perfect examples after the move has happened.
- Keep screenshots of winning and losing setups. Patterns in your mistakes become easier to see visually.
- Do not call a moving average “support” unless price also shows reaction or structure around that area.
- Expect lag. A moving average will never catch the exact top or bottom, and that is normal.
- Use demo trading to practice execution, but remember that live emotions feel different because real money changes behavior.
■ Moving averages compared with other forex indicators
| Tool | Main purpose | How it pairs with moving averages |
|---|---|---|
| RSI | Shows momentum and possible overbought/oversold pressure. | Use RSI to avoid buying when momentum is stretched or to confirm pullback strength. |
| MACD | Uses moving averages to show momentum changes. | Can confirm crossovers, but it also lags, so avoid stacking lagging signals only. |
| Bollinger Bands | Shows volatility around a moving average. | Useful for seeing expansion, contraction, and mean reversion conditions. |
| Support and resistance | Shows areas where price reacted before. | A moving average pullback is stronger when it lines up with a real price level. |
| ATR | Measures volatility. | Helps place stops outside normal market noise instead of guessing. |
■ Frequently asked questions
1. What is the best moving average for forex trading?
There is no single best moving average. Many beginners start with the 20 EMA, 50 EMA, and 200 EMA because they cover short-term, medium-term, and long-term trend context. The best setting is the one that fits your strategy, timeframe, and risk rules.
2. Is EMA better than SMA for forex?
EMA reacts faster because it gives more weight to recent prices. SMA is smoother and slower. EMA can be better for active entries, while SMA can be better for big-picture trend filtering. Neither is automatically better in all market conditions.
3. Can moving averages make forex trading profitable?
Moving averages alone do not make trading profitable. Profitability depends on strategy testing, market conditions, risk management, execution, psychology, and costs such as spread and slippage.
4. Which moving average crossover is best?
Popular combinations include 9/21 EMA, 10/30 EMA, 20/50 EMA, and 50/200 SMA or EMA. A crossover is most useful when it aligns with the higher timeframe trend and avoids sideways markets.
5. Should beginners use moving averages?
Yes, moving averages are useful for beginners because they simplify trend direction. However, beginners should learn their limitations early and avoid treating them as prediction tools.
6. Do moving averages work on all currency pairs?
They can be applied to any pair, but results vary. Major pairs are often easier for beginners because they usually have better liquidity and tighter spreads than exotic pairs.
7. What timeframe is best for moving averages in forex?
The 1-hour and 4-hour charts are often more beginner-friendly than very low timeframes. Lower timeframes can create more signals, more noise, and more emotional decisions.
8. How do I avoid false moving average signals?
Avoid trading in ranges, wait for candle closes, use higher timeframe confirmation, check support and resistance, and manage risk. False signals cannot be removed completely, only reduced.
■ Final thoughts
Moving averages are popular in forex trading because they make price action easier to read. They help beginners see trend direction, avoid random trades, wait for pullbacks, and build simple rules. But they are not magic. They lag, they fail in ranges, and they cannot protect you from poor risk management.
The most effective way to use moving averages is simple: use them to understand market context, combine them with price structure, control your risk, and review your trades honestly. A beginner who uses one clear moving average strategy with discipline will usually learn faster than a trader who keeps searching for the perfect setting.
Sources and trust notes used while preparing this article
- CFTC Customer Advisory: Eight Things You Should Know Before Trading Forex. Used for margin and leverage risk framing.
- NFA forex regulatory resources. Used for retail forex compliance and risk awareness context.
- Charles Schwab learning material and risk disclosures on forex margin. Used for plain-language discussion of leverage and potential losses.
- Investopedia educational resources on forex, moving averages, MACD, and swing trading. Used as general educational reference points.
Reader Advice: This article is provided for educational and informational purposes only and should not be considered financial, investment, or trading advice. Forex trading involves risk. Before making any trading decisions, take the time to study the forex market thoroughly, understand the risks, and evaluate whether trading is appropriate for your financial situation and experience. Always make informed decisions based on your own research, and consider seeking guidance from a qualified financial professional when needed.