MACD Indicator: How to Use MACD in Forex Trading
1. What Is the MACD Indicator?
MACD stands for Moving Average Convergence Divergence. The name sounds technical, but the idea is simple: MACD compares a faster moving average with a slower moving average to show whether price momentum is getting stronger or weaker.
For a forex trader, MACD is like a momentum dashboard. It does not tell you, “Buy now and you will win.” Instead, it helps answer better questions: Is the market gaining strength? Is the trend slowing down? Is a pullback possibly ending? Is this signal happening in the same direction as the bigger trend?
Most charting platforms show MACD in a separate window below the price chart. You usually see two lines and a histogram. When these parts move together, they can help you understand trend direction, momentum, and possible timing. When they disagree with price, they may warn that a move is losing energy.
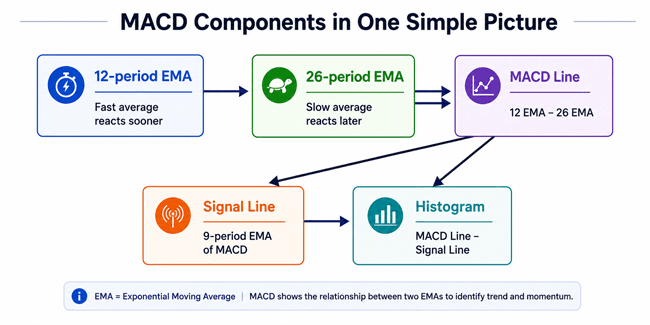
Figure 1. Original simplified diagram of MACD components.
2. Why Forex Traders Use MACD
Forex markets often move in waves. A currency pair may trend strongly during a central bank news cycle, then drift sideways for hours, then suddenly accelerate again. MACD is popular because it helps traders see those changes in momentum without needing advanced mathematics.
Beginner traders like MACD because it is already built into most forex trading platforms, including MetaTrader-style platforms, TradingView-style charting tools, and broker chart packages. More experienced traders often use it as a confirmation tool rather than a complete trading system.
In real trading communities, many traders describe MACD as useful when the market is trending and less reliable when price is trapped in a tight range. That practical observation matters. MACD is built from moving averages, so it naturally works best when price movement has enough direction for averages to separate clearly.
■ The Three Parts of MACD
1. MACD line
The MACD line is the difference between a fast EMA and a slow EMA. In the common default setting, it is the 12-period EMA minus the 26-period EMA. When the MACD line rises, short-term momentum is improving compared with longer-term momentum.
2. Signal line
The signal line is usually a 9-period EMA of the MACD line. It smooths the MACD line and gives traders a reference point for crossovers.
3. Histogram
The histogram shows the distance between the MACD line and the signal line. Growing bars mean the gap is widening. Shrinking bars mean momentum may be cooling.
■ How MACD Is Calculated in Simple Words
The standard MACD setting is written as 12, 26, 9. This means:
- 12-period EMA: the faster average.
- 26-period EMA: the slower average.
- 9-period signal line: the smoothing average of the MACD line.
Formula: MACD line = 12-period EMA - 26-period EMA. Signal line = 9-period EMA of the MACD line. Histogram = MACD line - signal line.
You do not need to calculate this by hand to trade. Your platform does it automatically. But understanding the formula helps you avoid a common beginner mistake: MACD is not magic. It is a picture of moving averages. Because moving averages react after price has moved, MACD can be late, especially after sudden news spikes.
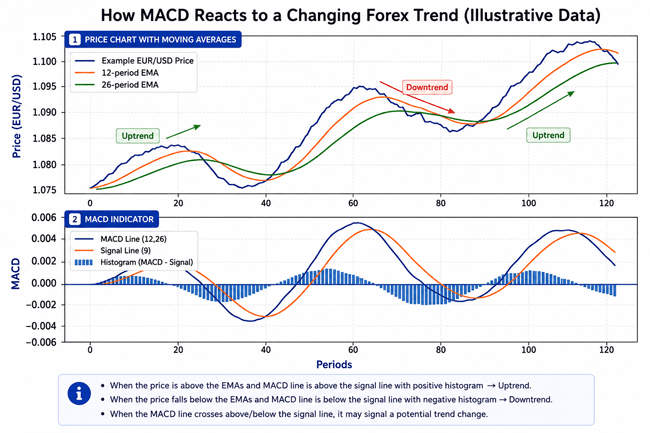
Figure 2. Illustrative EUR/USD-style data showing price, EMAs, MACD line, signal line, and histogram.
■ How to Read MACD Signals
1. MACD line and signal line crossover
A bullish crossover happens when the MACD line crosses above the signal line. A bearish crossover happens when the MACD line crosses below the signal line. Beginners often treat every crossover as a trade signal, but that is usually too simple. A crossover is more useful when it agrees with trend, support or resistance, market structure, and risk-reward.
2. Zero-line crossover
The zero line is the level where the fast EMA and slow EMA are equal. When MACD moves above zero, short-term momentum is stronger than longer-term momentum. When MACD moves below zero, short-term momentum is weaker. Many traders use the zero line as a trend filter: they prefer buy setups above zero and sell setups below zero.
3. Histogram expansion and contraction
The histogram is useful because it shows momentum visually. If bullish histogram bars are growing, upside momentum may be increasing. If bullish bars are shrinking while price is still rising, the move may be losing power. This does not mean price must reverse. It simply means the trader should become more selective.
4. MACD divergence
Divergence happens when price and MACD do not agree. For example, price makes a higher high but MACD makes a lower high. That can show weakening bullish momentum. Divergence can be helpful near major support or resistance, but it is not a guaranteed reversal signal. In strong forex trends, divergence can appear several times before price finally turns.
■ Quick Comparison: What Each MACD Signal Is Good For
| Signal | What it suggests | Best use | Beginner warning |
|---|---|---|---|
| Signal-line crossover | Short-term momentum shift | Entry timing after trend confirmation | Can whipsaw in sideways markets |
| Zero-line crossover | Trend bias may be changing | Filtering buys and sells | Often late after a fast move |
| Histogram shrinking | Momentum may be slowing | Managing exits or avoiding late entries | Shrinking does not equal reversal |
| Divergence | Price move may be weakening | Reversal watch near key levels | Can appear too early |
3. A Practical MACD Forex Trade Example
Imagine EUR/USD has been making higher highs and higher lows on the 1-hour chart. Price pulls back into a previous support zone. You do not buy only because price touches support. You wait for evidence that bearish pullback momentum is fading.
- First, mark the trend: higher highs and higher lows suggest an uptrend.
- Second, mark the pullback area: previous resistance may now act as support.
- Third, watch MACD: the histogram moves from deeply negative bars to smaller negative bars, showing selling pressure is slowing.
- Fourth, wait for a bullish MACD line crossover or a strong bullish candle at support.
- Fifth, plan risk before entry: stop-loss below the support swing low, not randomly close to the entry.
- Sixth, target a realistic area: previous high, a measured move, or a reward-to-risk ratio such as 1.5:1 or 2:1.
The important lesson is that MACD is not the full reason for the trade. It is one confirmation inside a complete trading plan. This is how careful traders use indicators: not as prediction machines, but as decision-support tools.
4. Best MACD Settings for Forex
The default MACD setting, 12, 26, 9, is still the most common starting point. It works across many currency pairs and timeframes because traders around the world recognize it. But “best” depends on your trading style.
| Trader type | Possible setting | Why traders use it | Main risk |
|---|---|---|---|
| Beginner swing trader | 12, 26, 9 | Balanced and widely understood | May be late at reversals |
| Intraday trader | 8, 21, 5 or similar | Faster reaction on lower timeframes | More false signals |
| Trend follower | 12, 26, 9 with a higher-timeframe filter | Avoids fighting the main direction | Fewer trades |
| Scalper | Very fast custom settings | Catches tiny momentum shifts | Spread and noise can dominate |
For beginners, changing settings too often is usually a mistake. It creates the illusion of control. A better approach is to choose one setting, test it on one or two currency pairs, and record results over at least 30 to 50 sample setups before deciding whether to adjust it.
■ MACD Strategy Ideas for Beginners
Strategy 1: Trend filter plus MACD crossover
Use a higher timeframe to decide direction. For example, if the 4-hour chart is in an uptrend, look for 1-hour bullish MACD crossovers near pullback zones. This keeps you from buying and selling randomly on every crossover.
Strategy 2: MACD with support and resistance
MACD becomes more useful when combined with price levels. A bullish crossover in the middle of nowhere is weaker than a bullish crossover at a tested support zone after sellers have failed to push price lower.
Strategy 3: MACD divergence at major levels
Divergence is best treated as an alert, not an entry by itself. If GBP/USD makes a lower low into a weekly support zone while MACD makes a higher low, you can watch for a reversal candle, break of minor structure, or bullish crossover before considering a trade.
Strategy 4: Histogram exit management
Some traders use the histogram to manage open trades. If a long trade is profitable but bullish histogram bars start shrinking near resistance, they may move the stop, take partial profit, or avoid adding more size. This is not perfect, but it can help reduce emotional decisions.
■ MACD vs RSI vs Moving Averages
| Tool | Main purpose | Best market condition | Strength | Weakness |
|---|---|---|---|---|
| MACD | Trend momentum | Trending or transitioning markets | Shows momentum changes clearly | Can lag and whipsaw |
| RSI | Momentum and overbought/oversold reading | Range-bound or pullback analysis | Easy levels such as 70/30 | Can stay extreme in strong trends |
| Moving averages | Trend direction and dynamic support/resistance | Trending markets | Simple trend filter | Late during reversals |
| Price action | Market structure and levels | All markets | Shows actual buyer/seller behavior | Requires practice and context |
A strong beginner setup is often simple: market structure for direction, support and resistance for location, MACD for momentum, and a fixed risk plan for survival. Adding more indicators does not automatically make the strategy better. It often creates confusion.
■ Common Beginner Mistakes With MACD
Mistake 1: Taking every crossover
Crossovers appear frequently. In a ranging market, they can produce a chain of small losses. Always ask: Is this signal happening at a meaningful level and in a sensible market condition?
Mistake 2: Ignoring spreads and trading costs
On lower timeframes, a small MACD signal may not be large enough to overcome spread, slippage, and commissions. This is why broker choice, forex broker comparison, and realistic trading costs matter.
Mistake 3: Using MACD against major news
MACD reacts to price, but news can move price faster than indicators can adjust. During central bank decisions, inflation releases, or employment data, technical signals can fail suddenly.
Mistake 4: Moving the stop-loss after entry
A trader may enter because MACD looks bullish, then hold after the trade turns bearish because they “believe” it will come back. This is not strategy. It is hope.
Mistake 5: Changing settings after every loss
Losses are normal. Constantly changing settings prevents you from learning whether the method has a real edge.
■ Risk Management Checklist for MACD Forex Traders
- I know the exact reason for entry before placing the trade.
- I know where the trade idea is wrong before entry.
- I use a stop-loss and position size that limits damage if I am wrong.
- I avoid increasing leverage just because a MACD signal looks strong.
- I check the economic calendar before trading major pairs.
- I do not treat forex signals, trading bots, or indicator alerts as guaranteed income.
- I keep a journal with screenshots, entry reason, exit reason, and emotional notes.
- I review at least 30 to 50 trades before judging a MACD strategy.
■ How to Use MACD on a Trading Platform
Most platforms add MACD in a few clicks. Search for “MACD” or “Moving Average Convergence Divergence” in the indicators menu. Keep the default 12, 26, 9 settings at first. Then place the indicator under your chart, not over price, so you can see both market structure and momentum clearly.
When comparing the best forex trading platform or a forex broker for beginners, do not choose only because the platform has MACD. Nearly every serious platform has it. More practical factors include regulated status, spreads, execution quality, chart reliability, customer support, educational tools, risk warnings, and whether demo trading is available.
■ Beginner-Friendly MACD Trading Plan Template
Use this template as an educational framework. Adapt it only after testing.
- Market: one or two major pairs, such as EUR/USD or GBP/USD, to reduce spread and complexity.
- Timeframe: 1-hour entries with 4-hour trend context.
- Indicator: MACD 12, 26, 9.
- Buy conditions: 4-hour trend up, price pulls into support, histogram stops falling, MACD line crosses above signal line, entry after candle close.
- Sell conditions: 4-hour trend down, price rallies into resistance, histogram stops rising, MACD line crosses below signal line, entry after candle close.
- Risk: small fixed percentage per trade, with stop-loss at a logical invalidation point.
- Exit: partial or full exit near previous swing level, or if opposite momentum appears at a major level.
- Review: screenshot every trade and write whether the result came from good process or emotional behavior.
■ Frequently Asked Questions
1. What does MACD stand for?
MACD stands for Moving Average Convergence Divergence.
2. What are the default MACD settings?
The common default setting is 12, 26, 9: a 12-period EMA, a 26-period EMA, and a 9-period signal line.
3. Is MACD better than RSI?
Neither is always better. MACD is often used for trend momentum, while RSI is often used for overbought/oversold analysis and momentum extremes. Many traders use them together, but too many indicators can create confusion.
4. What is a bullish MACD crossover?
It happens when the MACD line crosses above the signal line. Traders often read it as improving bullish momentum, but it should be confirmed with context.
5. What is MACD divergence?
Divergence happens when price makes a new extreme but MACD does not confirm it. It can warn that momentum is weakening.
6. Should I use MACD for scalping?
It can be used, but scalping is difficult because spreads, slippage, and noise matter more on very short timeframes. Beginners usually need slower charts first.
7. Can I trade MACD without a stop-loss?
That is not a responsible approach. A stop-loss or defined exit plan is essential because any indicator can fail.
8. Is MACD good for forex trading?
MACD can be useful in forex trading, especially when a currency pair is trending or recovering from a pullback. It is less useful when the market is flat, choppy, or moving only because of sudden news. It should be combined with price action and risk management.
9. Can beginners use MACD?
Yes. MACD is one of the easier technical indicators for beginners because it is visual and widely available. However, beginners should first learn what a trend, pullback, support, resistance, spread, leverage, and stop-loss mean. Without those basics, MACD signals can be misunderstood.
10. Which timeframe is best for MACD?
There is no universal best timeframe. Lower timeframes produce more signals but more noise. Higher timeframes produce fewer signals but often cleaner context. Many beginners do better starting with 1-hour, 4-hour, or daily charts rather than very fast 1-minute charts.
11. Does MACD repaint?
The standard MACD does not normally repaint completed candles. However, the current live candle can change until it closes. A crossover that appears during a candle may disappear before the candle closes. This is why many traders wait for candle close confirmation.
12. Can MACD make consistent profit?
MACD alone does not create consistent profit. Consistency depends on a tested strategy, realistic costs, good execution, position sizing, emotional control, and market selection. Any article, trading course, forex signal service, or trading software that suggests guaranteed profit should be treated with caution.
■ Final Thoughts
MACD is popular because it makes momentum easier to see. For a beginner forex trader, that is valuable. But the real skill is not memorizing crossover rules. The real skill is learning when a MACD signal matters and when it should be ignored.
A good MACD trader thinks in context: trend first, location second, momentum third, risk always. If you remember only one line from this guide, remember this: MACD can help you read the market, but risk management keeps you in the game long enough to learn.
Reader Advice: This article is provided for educational and informational purposes only and should not be considered financial, investment, or trading advice. Forex trading involves risk. Before making any trading decisions, take the time to study the forex market thoroughly, understand the risks, and evaluate whether trading is appropriate for your financial situation and experience. Always make informed decisions based on your own research, and consider seeking guidance from a qualified financial professional when needed.