How to Use RSI in Forex Trading: Best RSI Strategy & Settings for Beginners
1. Why Forex Traders Care About RSI
The RSI indicator is one of the first technical indicators many forex traders add to a chart because it looks simple: a line moving between 0 and 100. But the mistake beginners often make is thinking RSI is a magic buy or sell signal. It is not. RSI is better understood as a momentum meter. It helps you see whether price has been moving up or down too quickly, whether momentum is strengthening or fading, and whether a trade idea needs more confirmation before you risk money.
In forex trading, this matters because currency pairs can trend strongly after news, central-bank decisions, inflation reports, employment data, or risk sentiment changes. A pair can look “overbought” and still keep rising. It can look “oversold” and still keep falling. Good RSI trading is therefore not about blindly buying at 30 and selling at 70. It is about combining RSI with market context, price structure, and honest risk management.
This guide explains RSI in plain language, then shows how a beginner can use it practically on a forex chart without falling into the usual traps.
2. What Is the RSI Indicator?
RSI stands for Relative Strength Index. It is a momentum oscillator developed by J. Welles Wilder Jr. The indicator measures the speed and size of recent price moves and converts that information into a value from 0 to 100. Most platforms use a 14-period RSI by default.
In simple words, RSI asks: “Compared with recent down moves, how strong have the recent up moves been?” If recent gains are much stronger than recent losses, RSI rises. If recent losses are stronger than recent gains, RSI falls.
Traditional RSI levels are:
- Above 70: often called overbought.
- Below 30: often called oversold.
- Around 50: often treated as the middle momentum line.
These levels do not mean the market must reverse. They mean momentum has reached an extreme or the balance of momentum has changed. That difference is very important.
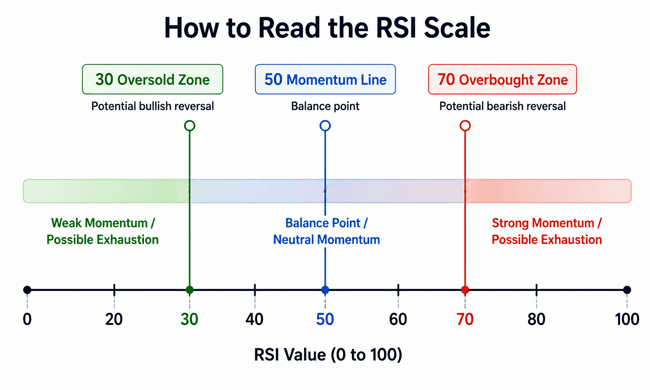
Image: RSI scale from 0 to 100 showing 30 oversold, 50 momentum, and 70 overbought levels.
3. How RSI Works: The Formula in Beginner Language
You do not need to calculate RSI manually to use it, because every modern forex trading platform calculates it automatically. But knowing the logic helps you avoid false confidence.
The common RSI formula is: RSI = 100 - [100 / (1 + RS)]. RS means average gain divided by average loss over the chosen period. With the standard 14-period RSI, the indicator looks at the last 14 candles, smooths the average gains and losses, and produces one number between 0 and 100.
A practical way to think about it:
- If price has been closing higher with strong candles, RSI usually climbs.
- If price has been closing lower with strong candles, RSI usually drops.
- If price is moving sideways, RSI often moves around the middle zone.
- If RSI reaches an extreme, it tells you momentum is stretched, not that reversal is guaranteed.
■ What Beginners Should Know Before Using RSI in Forex
RSI is easy to read, but it is also easy to misuse. Before you build any RSI forex trading strategy, understand these practical points.
1. RSI reacts to candle closes, not the future.
RSI is based on past price movement. It can help you organize what price has already done, but it cannot know what the next candle will do. Treat it as a decision-support tool, not a prediction machine.
2. RSI can stay overbought or oversold for a long time.
In a strong trend, RSI may stay above 70 while price keeps rising, or below 30 while price keeps falling. Beginners who trade against the trend too early often get stopped out several times before the real pullback begins.
3. The 50 line is often more useful than beginners realize.
Many new traders focus only on 30 and 70. Experienced traders also watch the 50 line. In a bullish environment, RSI holding above 50 can show that buyers still control momentum. In a bearish environment, RSI struggling below 50 can show that sellers still control momentum.
4. RSI works better with structure.
Structure means support, resistance, trendlines, swing highs, swing lows, and price zones where the market has reacted before. RSI at 30 in the middle of nowhere is weaker than RSI near a clear support area after a long drop.
5. Risk management matters more than the indicator.
A clean RSI signal can still lose. Every trade needs a stop-loss plan, position sizing, and a reason to exit. If a strategy depends on “I hope it comes back,” it is not a strategy.
■ How to Add RSI to a Forex Chart
- Open your forex trading platform or charting platform.
- Choose a currency pair, such as EUR/USD, GBP/USD, USD/JPY, or XAU/USD if your platform offers metals.
- Select “Indicators” and search for “Relative Strength Index” or “RSI.”
- Keep the default period at 14 while learning.
- Add horizontal levels at 30, 50, and 70.
- Look at how RSI behaved during recent trends, ranges, breakouts, and reversals before placing any trade.
Beginner tip: do not keep changing RSI settings after every losing trade. First learn how the standard 14-period RSI behaves. Later, you can test faster or slower settings.
4. Best RSI Settings for Forex Trading
The most common RSI setting is 14 periods. On a daily chart, that means 14 daily candles. On a 1-hour chart, it means 14 hourly candles. The setting does not know whether you are looking at forex, stocks, crypto, or commodities. It simply reads the last 14 candles of the selected timeframe.
Here is a practical comparison:
| RSI setting | Behavior | Possible use | Beginner caution |
|---|---|---|---|
| 7 RSI | Faster and more sensitive | Short-term scalping tests | More false signals and noise |
| 14 RSI | Balanced default setting | General learning and swing/day trading | Still needs confirmation |
| 21 RSI | Slower and smoother | Trend filtering and higher timeframes | Signals may arrive late |
| 30/70 levels | Traditional extremes | Range markets and pullback alerts | Poor alone in strong trends |
| 20/80 levels | Stricter extremes | Strong-trend filtering | Fewer signals, more patience required |
For most beginners, 14 RSI with 30/50/70 levels is enough. A trader should improve the decision process before trying to improve the indicator settings.
5. How to Use RSI in Forex Trading: Practical Methods
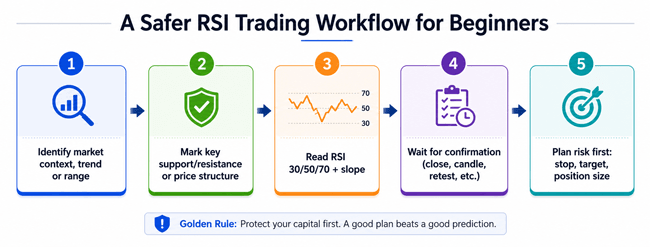
Image: Five-step RSI trading workflow: market context, structure, RSI reading, confirmation, and risk plan.
Method 1: RSI Overbought and Oversold
The classic approach is simple: RSI above 70 suggests the pair may be overbought, while RSI below 30 suggests it may be oversold. But a safer way to use this is as an alert, not an automatic trade.
Example: EUR/USD falls into a previous support zone and RSI drops below 30. Instead of buying immediately, a patient trader waits for a bullish candle close, a break of a small lower-timeframe trendline, or a second test of support. RSI tells the trader to pay attention; price confirmation gives the trade idea more structure.
Method 2: RSI and the 50 Line
The 50 line can act like a quick momentum filter. If RSI is above 50, buyers have the stronger recent momentum. If RSI is below 50, sellers have the stronger recent momentum.
A simple rule some traders test is: look for long setups only when RSI is above 50, and short setups only when RSI is below 50. This does not guarantee success, but it can stop beginners from constantly fighting the dominant move.
Method 3: RSI Divergence
Divergence happens when price and RSI disagree. Bullish divergence appears when price makes a lower low but RSI makes a higher low. Bearish divergence appears when price makes a higher high but RSI makes a lower high.
Divergence can be useful because it shows momentum may be weakening. But it can also appear too early. A common beginner mistake is shorting every bearish divergence in a strong uptrend. A better approach is to wait until price also breaks structure, rejects resistance, or fails to continue.
Method 4: RSI Failure Swing
A failure swing is an RSI pattern where the indicator reaches an extreme, pulls back, fails to retest the extreme, and then breaks a prior RSI swing level. Traders use it as a sign that momentum has shifted. It is more advanced than basic 30/70 readings, but it teaches an important lesson: RSI patterns need confirmation, not emotion.
Method 5: RSI Pullback in a Trend
One of the most practical RSI uses in forex is not catching reversals but joining trends. In an uptrend, RSI may pull back toward 40-50 while price returns to support or a moving average. In a downtrend, RSI may bounce toward 50-60 while price retests resistance. This approach tries to trade with momentum instead of guessing tops and bottoms.
6. Practical Example: Using RSI on a Hypothetical EUR/USD Trade
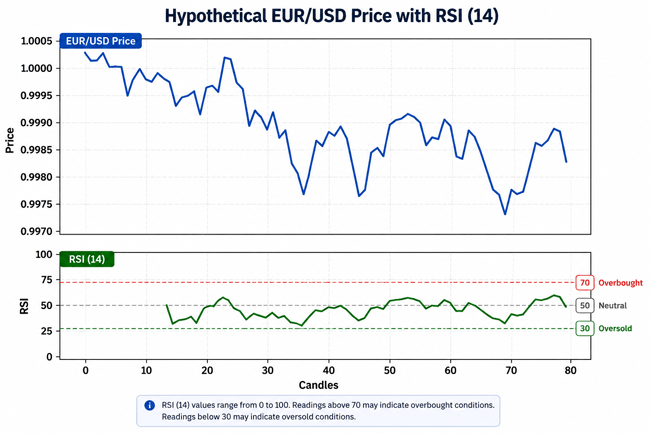
Image. Hypothetical EUR/USD price chart with RSI 14 below it, showing 30, 50, and 70 levels.
Imagine EUR/USD has been moving in a short-term trend on the 1-hour chart. Price then pulls back toward a previous support area. RSI cools toward the 45-50 area instead of collapsing deeply below 30. This tells you the market may be pausing or losing speed, not automatically reversing.A beginner-friendly trade plan might look like this:
- Market context: short-term uptrend.
- Price area: pullback into prior support.
- RSI clue: RSI holds near 45-50 instead of collapsing below 30.
- Confirmation: a bullish candle closes above the previous candle high.
- Entry idea: enter only after confirmation, not while price is still falling.
- Invalidation: if price breaks support and closes below it, the idea is wrong.
- Risk plan: risk a small fixed percentage, such as 1% or less, depending on personal rules and account size.
- Exit idea: take partial profit near the prior high or trail only if the trend continues.
This example is not a recommendation to trade EUR/USD. It shows the thinking process: RSI supports the idea, but price structure and risk control decide whether the trade is reasonable.
7. RSI Forex Strategy for Beginners: A Simple Template
Here is a basic RSI strategy template a beginner can backtest before using real money.
Long setup checklist:
- Currency pair is in an uptrend or near a clear support zone.
- RSI pulls back toward 30-50, depending on trend strength.
- Price shows rejection, such as a bullish close, higher low, or support hold.
- Stop-loss is placed where the trade idea is invalid, not randomly.
- Potential reward is at least equal to or greater than the risk.
Short setup checklist:
- Currency pair is in a downtrend or near a clear resistance zone.
- RSI rises toward 50-70, depending on trend strength.
- Price shows rejection, such as a bearish close, lower high, or failed breakout.
- Stop-loss is placed beyond the structure that would prove the idea wrong.
- Profit target is based on support, prior lows, or a measured risk-reward plan.
8. RSI vs MACD vs Stochastic: Which Is Better?
| Indicator | What it mainly shows | Best use | Main weakness |
|---|---|---|---|
| RSI | Speed and size of recent gains vs. losses | Overbought/oversold, momentum shifts, divergence | Can stay extreme in strong trends |
| MACD | Relationship between moving averages | Trend direction and momentum changes | Can lag after fast moves |
| Stochastic | Current close compared with the recent high-low range | Range trading and short-term turns | Can be noisy in trends |
No indicator is “best” in every market. RSI is popular because it is simple and visual. MACD can help with trend confirmation. Stochastic can be useful in ranges. The best choice depends on the trader’s timeframe, market conditions, and discipline.
9. Common RSI Mistakes Beginners Make
- Buying only because RSI is below 30, without checking trend or support.
- Selling only because RSI is above 70, while price is in a strong bullish breakout.
- Changing settings repeatedly instead of testing one method properly.
- Using too much leverage because the signal “looks obvious.”
- Ignoring news events that can make technical signals unreliable for a while.
- Taking every divergence instead of waiting for price confirmation.
- Using RSI as a complete trading system rather than one part of a plan.
- Following forex signals blindly without understanding the reason behind the trade.
10. Helpful Facts About RSI in Forex
- RSI does not measure volume. It measures price momentum.
- RSI on a 5-minute chart can give many signals, but many will be noise.
- Higher timeframes usually give fewer but cleaner signals.
- RSI works differently in trending and ranging markets.
- The same RSI reading can mean different things depending on support, resistance, volatility, and news.
- A good forex broker or online forex trading platform can provide charting tools, but tools do not replace education and risk control.
- Paid forex trading courses and forex signals should be evaluated carefully. Avoid anyone promising guaranteed returns.
11. Risk Management: The Part Most RSI Articles Skip
The honest truth is that a trader can use RSI correctly and still lose a trade. That is normal. What separates a planned trade from gambling is risk management.
Before entering any RSI-based trade, answer these questions:
- Where exactly is my stop-loss?
- What price action would prove my idea wrong?
- How much of my account am I risking?
- Is the potential reward worth the risk?
- Am I trading during major news or low liquidity?
- Am I taking this trade because it matches my plan or because I feel fear of missing out?
Forex leverage can magnify both gains and losses. This is why responsible educational content should never present RSI, forex signals, or any trading indicator as a guaranteed income tool. If a beginner wants to learn online forex trading, the first investment should be time spent learning risk, psychology, and execution.
12. Beginner RSI Backtesting Exercise
To understand RSI through experience, open a chart and complete this simple exercise before using real money:
- Choose one pair, such as EUR/USD.
- Choose one timeframe, such as 1-hour or 4-hour.
- Add RSI 14 with 30, 50, and 70 levels.
- Scroll back at least 100 candles.
- Mark every time RSI went below 30 or above 70.
- Write down whether price reversed, continued, or moved sideways afterward.
- Now add support and resistance. Notice how RSI signals near structure are usually more meaningful.
- Repeat the exercise in a trending market and a ranging market.
- Record what worked, what failed, and what conditions made the difference.
This exercise is simple but powerful. It teaches the trader that RSI is not a button to press. It is a lens for reading momentum.
■ FAQ: RSI Indicator in Forex Trading
1. Is RSI good for forex trading?
RSI can be useful in forex trading when combined with market context, support and resistance, and risk management. It is not reliable as a standalone buy/sell signal.
2. What is the best RSI setting for forex?
The default 14-period RSI is the best starting point for most beginners. Faster settings create more signals but more noise. Slower settings are smoother but can react late.
3. Should I buy when RSI is below 30?
Not automatically. RSI below 30 means the pair may be oversold, but in a strong downtrend it can stay oversold. Wait for price confirmation and a clear risk plan.
4. Should I sell when RSI is above 70?
Not automatically. RSI above 70 can show strong bullish momentum, not just an overbought market. Look at trend, resistance, and confirmation first.
5. Can RSI be used for scalping?
Yes, some traders use RSI for scalping, but lower timeframes are noisy and require strict execution. Beginners often learn better on higher timeframes first.
6. Is RSI better than MACD?
RSI and MACD show different information. RSI focuses on momentum extremes and relative gains/losses. MACD focuses on moving-average momentum and trend shifts. Many traders compare both instead of choosing only one.
7. Does RSI work during news?
RSI can become less reliable during major news because price can move rapidly and ignore normal technical levels. Beginners should be cautious around high-impact news events.
■ Conclusion: The Smart Way to Use RSI
The RSI indicator is simple enough for a beginner to understand, but useful enough that experienced traders still watch it. Its real value is not in giving perfect signals. Its value is in helping you read momentum, identify stretched conditions, compare price strength, and avoid entering trades without a plan.
The safest beginner approach is to use RSI as one layer of evidence. First understand the trend or range. Then mark support and resistance. Then read RSI. Then wait for price confirmation. Finally, plan risk before entry. That is how RSI becomes a practical trading tool instead of a random line on the chart.
Reader Advice: This article is provided for educational and informational purposes only and should not be considered financial, investment, or trading advice. Forex trading involves risk. Before making any trading decisions, take the time to study the forex market thoroughly, understand the risks, and evaluate whether trading is appropriate for your financial situation and experience. Always make informed decisions based on your own research, and consider seeking guidance from a qualified financial professional when needed.