Candlestick Patterns Every Trader Should Know: Beginner's Trading Guide
1. Why Candlestick Patterns Matter
Candlestick patterns are one of the simplest ways to read what is happening on a price chart. They are popular in stock trading, forex trading, crypto trading, commodities, and index trading because they turn raw price movement into a visual story. A candle shows where price opened, how high and low it moved, and where it closed. When several candles appear together, they can reveal whether buyers are gaining control, sellers are becoming stronger, or the market is simply taking a pause.
For a beginner, the biggest benefit of candlestick chart patterns is not that they predict the future perfectly. They do not. Their real value is that they help you slow down and ask better questions: Who is in control right now? Is price rejecting a level? Is the trend still healthy? Is this breakout strong or weak? Is there enough room for a trade after fees, spread, and risk?
Many new traders search for the “best candlestick pattern” and expect one candle to change everything. Experienced traders usually think differently. They use candlesticks as clues, not commands. They combine them with support and resistance, trend direction, volume, market structure, and risk management. That is the honest and practical way to use candles.
2. What Is a Candlestick Pattern?
A candlestick pattern is a visual formation created by one or more candles on a trading chart. Each candle represents price movement during a chosen time period. On a daily chart, one candle shows one day. On a 15-minute chart, one candle shows 15 minutes. On a weekly chart, one candle shows one week.
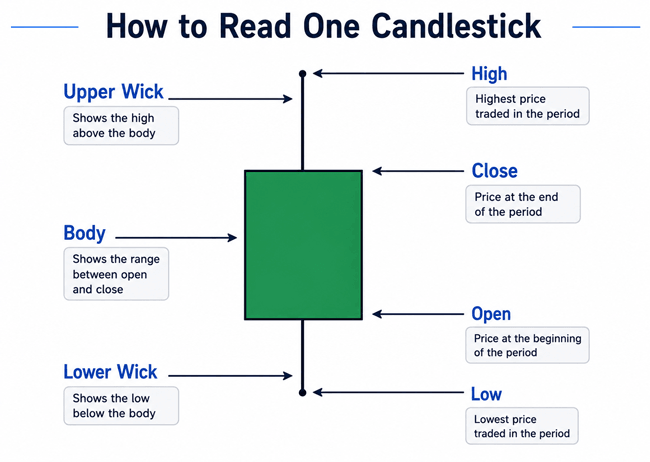
A candle has four important prices: open, high, low, and close. The open is where the period started. The close is where it ended. The high is the highest price reached during that period. The low is the lowest price reached. The thick part of the candle is called the body. The thin lines above and below the body are often called wicks or shadows.
If the close is higher than the open, the candle is usually shown as green, white, or hollow. This means buyers pushed price higher during that period. If the close is lower than the open, the candle is usually shown as red, black, or filled. This means sellers pushed price lower. The color can change depending on chart settings, so do not memorize only color. Learn the relationship between open and close.
3. How Candlesticks Work in Real Market Psychology
A candlestick is a small picture of a fight between buyers and sellers. A large green candle suggests buyers were strong from open to close. A large red candle suggests sellers were strong. A long lower wick shows that price fell, but buyers stepped in and pushed it back up. A long upper wick shows that price rose, but sellers rejected the higher price.
This is why candlestick patterns are often called price action trading tools. They do not come from a complicated formula. They come from actual price behavior. However, this also means they can be messy. A perfect hammer candle in a textbook may look different from a real chart. Real markets have gaps, news events, low-volume periods, fake breakouts, and emotional trading.
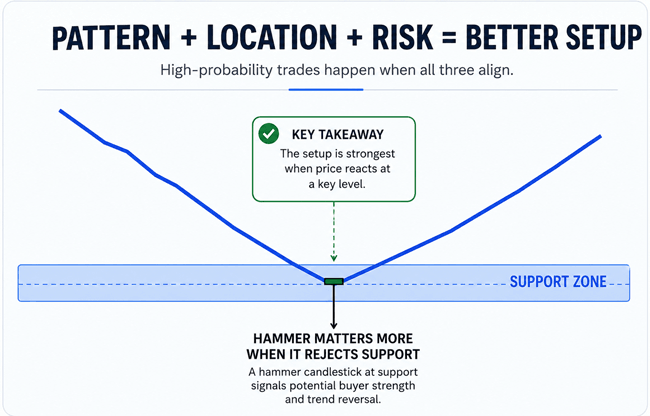
The practical lesson is simple: do not use candles alone. A bullish candle in the middle of nowhere is weaker than a bullish candle at a strong support area after a pullback. A bearish engulfing candle is more meaningful near resistance than in the middle of a sideways range. Context makes the pattern useful.
4. Beginner Basics: The Four Parts of Every Candle
Before learning patterns, beginners should understand candle anatomy. The body shows the distance between open and close. A large body means one side had strong control. A small body means the battle was balanced or undecided. The upper wick shows how high price tried to go before pulling back. The lower wick shows how low price tried to go before recovering.
A candle with a large body and tiny wicks often shows strong momentum. A candle with a small body and long wicks often shows uncertainty, rejection, or volatility. A candle with a long wick at an important level can show that traders tested a price area and rejected it.
Here is a simple way to read any candle: First, look at the body. Was the move strong or weak? Second, look at the wicks. Was price rejected from the top or bottom? Third, look at location. Did it happen at support, resistance, trendline, moving average, breakout area, or after a long move? Fourth, look at the next candle. Did the market confirm the message?
5. The Golden Rule: Pattern Plus Context
A candlestick pattern without context is like a sentence without the rest of the story. The same candle can mean different things in different places. A hammer after a long downtrend near support can suggest sellers are losing strength. A hammer after a strong uptrend may not mean much. A doji near resistance after a sharp rally may warn that buyers are tired. A doji in the middle of a quiet range may simply mean nothing important happened.
The most practical traders usually look for three layers of confirmation. The first layer is the pattern itself. The second layer is location, such as support, resistance, trend, or breakout zone. The third layer is risk-to-reward. Even a good setup is not worth taking if the stop-loss is too wide and the profit target is too close.
A beginner should remember this line: candles help you build a trading idea, but risk management decides whether the idea is tradable.
■ The Most Important Candlestick Patterns Every Trader Should Know
The following patterns are among the most commonly discussed candlestick chart patterns. The goal is not to memorize names only. The goal is to understand what each pattern says about buyer and seller behavior, where it matters, and when to avoid it.
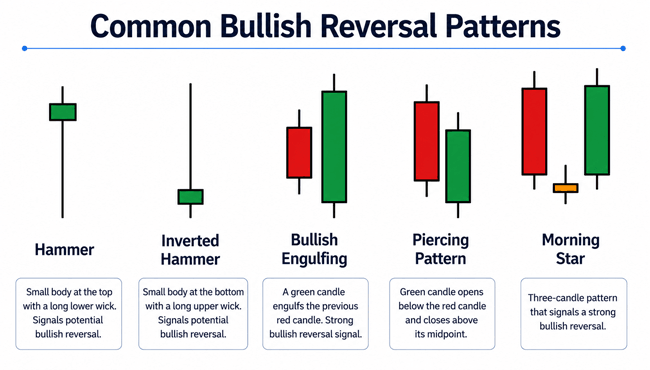
1. Hammer (Bullish reversal)
What it looks like: A small body near the top of the candle with a long lower wick.
What it means: After a decline, sellers push price lower, but buyers step in strongly before the candle closes. This suggests selling pressure may be weakening.
How beginners can use it: Look for it near support, a previous swing low, a trendline, or a moving average. Confirmation can be a close above the hammer high or a stronger bullish candle after it.
Common mistake: Do not buy every hammer. A hammer during a strong downtrend can fail quickly if the next candle closes below its low.
2. Inverted Hammer (Bullish reversal)
What it looks like: A small body near the bottom with a long upper wick.
What it means: Buyers tried to push price higher, even though the candle did not close strongly. It can show early interest from buyers after a decline.
How beginners can use it: Use it only when price is near support and the next candle confirms strength.
Common mistake: It is weaker than many traders think unless followed by a bullish confirmation candle.
3. Bullish Engulfing (Bullish reversal)
What it looks like: A green candle fully covers the body of the previous red candle.
What it means: Sellers controlled the first candle, but buyers came back with enough force to close above the previous body.
How beginners can use it: It works best after a pullback in an uptrend or near a clear support zone. Many traders enter after the engulfing candle closes or after a small pullback.
Common mistake: Avoid chasing if the candle is too large because the stop-loss may become too wide.
3. Piercing Pattern (Bullish reversal)
What it looks like: A bearish candle is followed by a bullish candle that opens lower but closes above the midpoint of the previous candle.
What it means: Sellers continue the decline at first, then buyers recover a meaningful part of the loss.
How beginners can use it: It can be useful near support when the market shows rejection of lower prices.
Common mistake: It is generally less powerful than a bullish engulfing pattern because buyers did not fully overcome the previous candle.
4. Morning Star (Bullish reversal)
What it looks like: A three-candle pattern: strong bearish candle, small indecision candle, strong bullish candle.
What it means: The first candle shows sellers in control. The second shows hesitation. The third shows buyers taking over.
How beginners can use it: Look for it after a clear down move, especially at support. Confirmation improves when the third candle closes strongly.
Common mistake: In fast markets, waiting for the full pattern may mean entering late. Always check risk-to-reward.
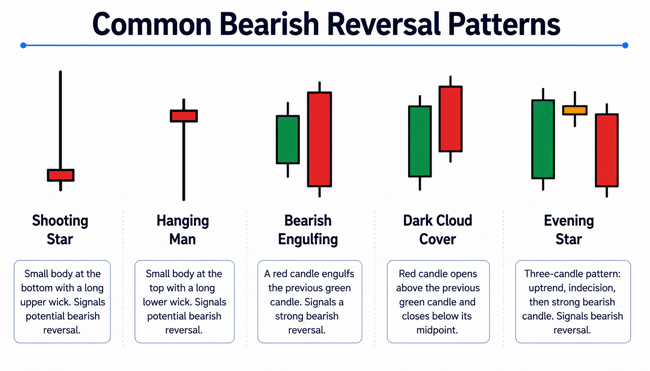
5. Shooting Star (Bearish reversal)
What it looks like: A small body near the bottom with a long upper wick.
What it means: Buyers pushed price up, but sellers rejected the move and forced the close lower.
How beginners can use it: It is most useful near resistance or after an extended rally. Some traders wait for the next candle to close below the shooting star low.
Common mistake: A shooting star in a strong uptrend can be only a pause, not a reversal.
6. Hanging Man (Bearish reversal)
What it looks like: A hammer-like candle that appears after an uptrend.
What it means: Price dropped during the candle, showing sellers entered, but buyers recovered some ground. It warns that the uptrend may be weakening.
How beginners can use it: Use it near resistance or after a long rally, and wait for bearish confirmation.
Common mistake: The shape looks like a hammer, so location is everything.
7. Bearish Engulfing (Bearish reversal)
What it looks like: A red candle fully covers the body of the previous green candle.
What it means: Buyers controlled the first candle, but sellers returned with stronger pressure.
How beginners can use it: It is stronger near resistance, after a failed breakout, or after a stretched move upward.
Common mistake: Do not short blindly if the larger trend is still strongly bullish.
8. Dark Cloud Cover (Bearish reversal)
What it looks like: A bullish candle is followed by a bearish candle that opens higher but closes below the midpoint of the previous candle.
What it means: The market starts with optimism, then sellers take control and erase much of the prior gain.
How beginners can use it: It can warn of weakness near resistance or after a fast rally.
Common mistake: Like the piercing pattern, it needs confirmation because it may only show temporary profit-taking.
9. Evening Star (Bearish reversal)
What it looks like: A three-candle pattern: strong bullish candle, small indecision candle, strong bearish candle.
What it means: The first candle shows buyers in control. The second shows hesitation. The third shows sellers taking over.
How beginners can use it: It is most useful after an uptrend near resistance or overbought conditions.
Common mistake: Avoid assuming a major crash. It may only lead to a normal pullback.
10. Doji (Indecision)
What it looks like: Open and close are very close, creating a tiny body.
What it means: Neither buyers nor sellers clearly won the candle. The market is undecided.
How beginners can use it: Use it as a warning sign at important levels, not as an entry by itself.
Common mistake: A doji in a choppy market can produce many false signals.
11. Spinning Top (Indecision)
What it looks like: Small body with upper and lower wicks.
What it means: Both sides tried to move price, but neither side kept control.
How beginners can use it: It can suggest hesitation after a strong move. Wait for breakout or confirmation.
Common mistake: It is common and should not be overvalued.
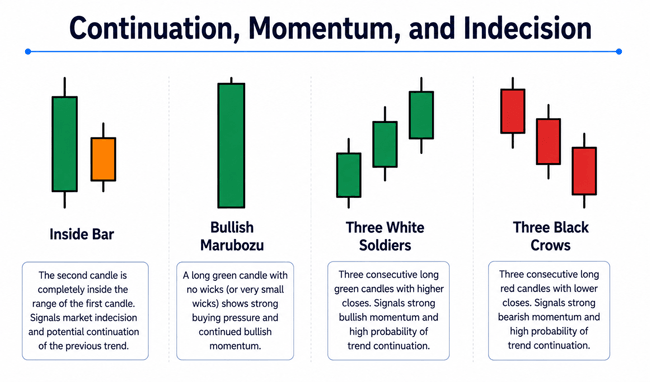
12. Marubozu (Momentum)
What it looks like: A candle with a large body and little or no wick.
What it means: One side controlled most of the session.
How beginners can use it: A bullish marubozu can confirm strong buying. A bearish marubozu can confirm strong selling.
Common mistake: After a very large candle, entering late can create poor risk-to-reward.
13. Three White Soldiers (Bullish continuation or reversal)
What it looks like: Three strong bullish candles in a row, often with higher closes.
What it means: Buyers show repeated strength across several candles.
How beginners can use it: Useful after a base, breakout, or early trend change.
Common mistake: If the candles are too extended, price may pull back before continuing.
14. Three Black Crows (Bearish continuation or reversal)
What it looks like: Three strong bearish candles in a row, often with lower closes.
What it means: Sellers show repeated strength across several candles.
How beginners can use it: Useful after a failed rally, breakdown, or distribution area.
Common mistake: Shorting after three large red candles can be late if price is already near support.
15. Inside Bar (Consolidation/continuation)
What it looks like: A candle forms completely inside the high and low of the previous candle.
What it means: The market pauses and compresses. Traders are waiting for direction.
How beginners can use it: Many traders watch for a breakout above or below the mother candle.
Common mistake: Inside bar breakouts can fail in sideways markets.
■ Candlestick Pattern Comparison Table
| Pattern | Signal Type | Best Location | Beginner Use | Main Risk |
|---|---|---|---|---|
| Hammer | Bullish reversal | Support after decline | Wait for a close above the hammer's high or other bullish confirmation. | Fails in strong downtrends. |
| Bullish Engulfing | Bullish reversal | Pullback/support | Buy only with a defined stop loss. | Stop may be too wide. |
| Morning Star | Bullish reversal | End of a down move | Use as a possible trend-change clue. | Late entry after the third candle. |
| Shooting Star | Bearish reversal | Resistance after rally | Wait for bearish confirmation. | May be only a pause in the uptrend. |
| Bearish Engulfing | Bearish reversal | Resistance/failed breakout | Sell only with trend or level support. | Dangerous in strong uptrends. |
| Evening Star | Bearish reversal | Top of rally | Watch for confirmation, such as a close below the midpoint of the first candle. | May lead only to a pullback. |
| Doji | Indecision | Support/resistance | Use as a warning, not a trigger. | Too common in choppy markets. |
| Inside Bar | Continuation/breakout | Trend pause | Wait for a confirmed breakout and use a stop loss. | False breakouts. |
| Marubozu | Momentum | Breakout/trend move | Use it to confirm strong momentum rather than as a reason to chase price. | Chasing after a big move. |
6. How Beginners Can Use Candlestick Patterns Step by Step
A beginner-friendly trading process should be simple. First, choose one market and one time frame. Do not jump between twenty charts. Second, mark the obvious support and resistance areas. Third, identify the trend. Is price making higher highs and higher lows, lower highs and lower lows, or moving sideways? Fourth, wait for a candlestick pattern at a meaningful location. Fifth, define entry, stop-loss, and target before entering. Sixth, record the trade in a journal whether it wins or loses.
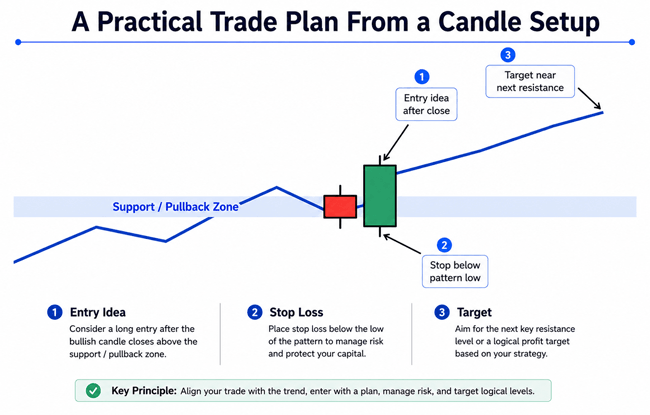
For example, suppose a stock is in an uptrend and pulls back to a previous breakout level. At that level, a bullish engulfing candle appears. A beginner may plan an entry above the engulfing candle high, a stop-loss below the candle low or below support, and a target near the next resistance. This is a structured plan. It is very different from buying only because a candle is green.
7. Practical Example 1: Bullish Engulfing at Support
Imagine a forex pair has been rising for several days, then pulls back to a level where buyers previously entered. The first candle at that area is red, showing sellers still have pressure. The next candle opens slightly lower but closes strongly above the previous red candle body. This is a bullish engulfing pattern.
A practical trader does not immediately think, “This must go up.” Instead, they ask: Is the larger trend still up? Is this support level clear? Is the spread reasonable? Is there upcoming major news? Is the stop-loss distance acceptable? If the answers are good, the trader may enter after the candle closes or on a small pullback. The invalidation point could be below the pattern low. If price breaks below that level, the idea was wrong and the trader exits.
8. Practical Example 2: Shooting Star Near Resistance
Imagine a crypto asset has rallied quickly into a resistance area. A candle forms with a long upper wick and a small body near the bottom. During that candle, buyers pushed price higher, but sellers rejected the move. This is a shooting star.
A beginner should not short only because of the candle. The safer approach is to wait for confirmation, such as the next candle closing below the shooting star low. The stop-loss may go above the wick high. The target might be the nearest support area. If the risk is $100 and the realistic target is only $80, the trade may not be worth taking even if the pattern looks attractive.
9. Practical Example 3: Inside Bar Breakout in a Trend
Suppose an index is trending upward and then forms a large bullish candle. The next candle stays completely inside the high and low of the previous candle. This is an inside bar, showing a pause. Some traders call the large candle the mother candle.
A continuation trader may place an alert above the mother candle high and below the mother candle low. If price breaks upward with strength, it can suggest trend continuation. But if price breaks upward and immediately falls back inside the range, that can be a false breakout. This is why stop-loss placement and position sizing matter more than being right every time.
10. How to Combine Candlesticks With Support and Resistance
Support is an area where price has previously found buyers. Resistance is an area where price has previously found sellers. Candlestick patterns become more useful when they appear around these areas. A hammer at support has a clearer message than a hammer floating in the middle of a chart. A bearish engulfing candle at resistance has more meaning than the same candle after price has already fallen heavily.
A simple method is to mark only the most obvious levels. Beginners often draw too many lines and confuse themselves. Use zones, not exact lines, because price rarely reacts to the exact same number every time. Then wait for a candle that shows rejection, momentum, or indecision near the zone.
11. How to Combine Candlesticks With Trend
Trend is one of the most important filters. In an uptrend, bullish candlestick patterns after pullbacks are often more useful than bearish reversal patterns. In a downtrend, bearish candlestick patterns after rallies are often more useful than bullish reversal patterns.
This does not mean countertrend trades never work. It means beginners usually make fewer emotional decisions when they trade with the main direction. A hammer in an uptrend pullback may be a continuation clue. A hammer in a strong downtrend may be only a small bounce before the next drop.
12. How to Combine Candlesticks With Volume
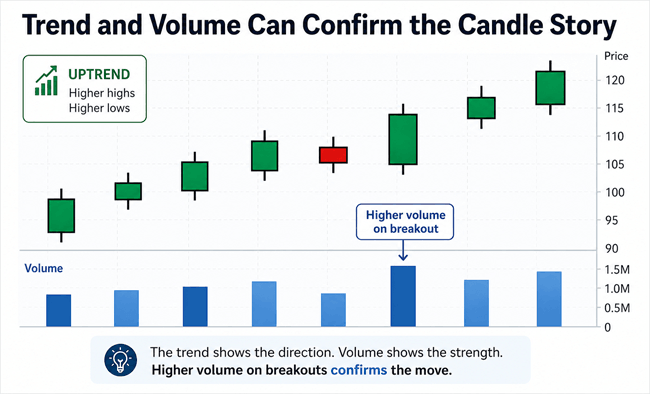
Volume shows how much trading activity happened during a candle. A breakout candle with higher volume may carry more weight than a breakout candle on low volume. A bullish engulfing pattern near support with strong volume can suggest real demand. A bearish engulfing pattern near resistance with strong volume can suggest serious selling.
Volume is not perfect. Some markets, such as decentralized crypto markets or spot forex, may have incomplete or broker-specific volume. Still, volume can help beginners avoid weak signals. If price breaks a key level with tiny volume, it may be wise to wait for more confirmation.
13. Risk Management: The Part Most Beginners Ignore
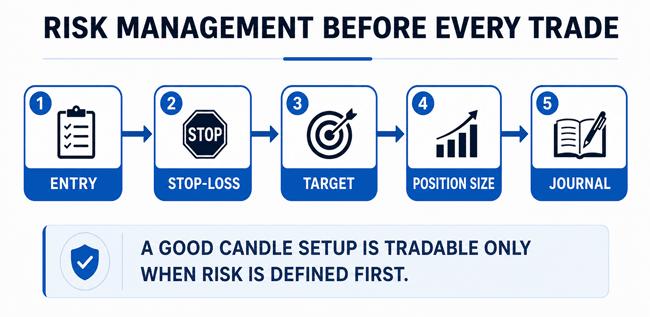
Candlestick patterns can help you find possible trades, but risk management keeps you alive long enough to learn. Many beginner traders lose money not because they cannot identify a hammer or engulfing candle, but because they risk too much, move stop-losses, chase candles, use high leverage, or trade during emotional moments.
A practical rule is to risk only a small fixed percentage of your trading capital on any single trade. Many educational traders discuss 1% or less per trade, especially for beginners. This does not guarantee safety, but it helps prevent one bad trade from damaging the account badly.
Before entering any trade, write down three numbers: entry, stop-loss, and target. If you cannot define these numbers, you do not have a trading plan. You only have a feeling.
14. The Honest Truth: Candlestick Patterns Are Not Magic
No candlestick pattern works all the time. A perfect bullish engulfing candle can fail. A textbook morning star can turn into a losing trade. A doji can appear before a reversal, continuation, or meaningless sideways movement. This is normal. Trading is a probability game, not a certainty game.
The best use of candlestick patterns is to create structured decisions. They help you avoid random entries. They help you understand market psychology. They help you define risk. But they should never be treated as guaranteed signals, secret formulas, or shortcuts to easy money.
15. Common Beginner Mistakes With Candlestick Patterns
The first mistake is memorizing patterns without understanding context. The second mistake is entering before a candle closes. A candle can look bullish halfway through the session and close bearish by the end.
The third mistake is using patterns on very low time frames without understanding noise, spread, and fees. The fourth mistake is ignoring news events. A strong economic release, earnings report, or regulatory headline can destroy a technical setup.
The fifth mistake is changing rules after entering. Beginners often enter with a stop-loss, then move it farther away when price gets close. This turns a planned small loss into a large emotional loss. The sixth mistake is judging a strategy by one trade. A single win does not prove a pattern works. A single loss does not prove it fails. You need a journal and a sample size.
16. Candlestick Patterns for Different Markets: Stocks, Forex, Crypto, and Options
Candlestick patterns appear in many markets, but each market has its own personality. Stocks can gap because of earnings, news, or overnight sentiment. Forex often reacts strongly to central bank decisions and economic data. Crypto trades around the clock and can be highly volatile. Options add extra complexity because time decay, implied volatility, and strike selection matter.
This is why a beginner should not copy a pattern blindly from one market to another. A hammer on a large-cap stock daily chart may be very different from a hammer on a small crypto token five-minute chart. The pattern name is the same, but liquidity, volatility, fees, and risk are different.
17. Best Time Frames for Beginners
Beginners often start on very low time frames because they want quick results. The problem is that one-minute and five-minute charts can be noisy, stressful, and expensive because of frequent trades. Daily, four-hour, or one-hour charts usually give beginners more time to think.
A useful approach is top-down analysis. Start with a higher time frame to understand the main trend and key levels. Then move to a lower time frame only to fine-tune entry. For example, a trader may use the daily chart for direction, the four-hour chart for support and resistance, and the one-hour chart for a candlestick trigger.
18. A Simple Candlestick Trading Checklist
Use this checklist before taking a candlestick-based trade. Is the market trending or ranging? Is the pattern at support, resistance, breakout, pullback, or another meaningful area? Has the candle closed? Is there confirmation from the next candle, volume, or market structure? Is the stop-loss logical? Is the target realistic? Is the risk-to-reward acceptable? Are there major news events soon? Are you trading because of a plan or because of fear of missing out?
 If several answers are unclear, skipping the trade is a valid decision. Professional behavior is not taking every trade. Professional behavior is taking only trades that match your plan.
19. Helpful Facts Beginners Should Know
Candlestick charts were popularized from Japanese rice trading history and later became common in modern technical analysis. Today, most trading platforms allow candlestick charts by default. Candle colors are customizable, so green and red are not universal. Patterns work better in liquid markets where price movement is more reliable. Backtesting can help, but manual review is also useful because real chart context matters.
Another helpful fact is that the same pattern can have different strength depending on candle size. A small bullish engulfing pattern after a tiny pullback may mean less than a strong bullish engulfing candle rejecting a major support zone. But a candle that is too large can also be hard to trade because the stop-loss becomes far away. Bigger is not always better.
20. How to Practice Without Losing Money
Beginners can practice candlestick patterns using paper trading, demo accounts, chart replay tools, or screenshots. A simple exercise is to collect 50 examples of one pattern, such as bullish engulfing. For each example, write down the trend, location, candle size, volume, entry idea, stop-loss, target, and what happened next.
This exercise teaches more than memorizing a list of patterns. It shows when patterns work better and when they fail. It also builds patience. After reviewing enough examples, beginners start to see that the best trades usually happen when several clues line up.
■ FAQs About Candlestick Patterns
- What is the easiest candlestick pattern for beginners? The hammer, shooting star, bullish engulfing, bearish engulfing, and doji are usually easiest to understand because their psychology is clear.
- Which candlestick pattern is most reliable? No pattern is always reliable. Many traders prefer engulfing patterns, morning star, evening star, and strong rejection candles when they appear at important levels, but reliability depends on context and risk management.
- Can candlestick patterns make you profitable? They can support better decisions, but they cannot guarantee profit. Profitability depends on strategy, discipline, risk control, market conditions, costs, and emotional management.
- Do candlestick patterns work in crypto? They can appear in crypto charts, but crypto markets can be highly volatile and news-driven. Use smaller position sizes and be careful with leverage.
- Should beginners trade every candlestick signal? No. Beginners should focus on a few patterns, clear levels, and high-quality setups. Skipping weak setups is part of good trading.
■ Final Thoughts
Candlestick patterns every trader should know are not just shapes on a chart. They are visual clues about fear, greed, hesitation, rejection, momentum, and control. For beginners, they are useful because they make price action easier to understand. But they are only one part of trading.
The best approach is simple: learn the candle story, wait for the right location, confirm the setup, manage risk, and keep records. Do not chase perfect predictions. Build repeatable habits. A trader who uses candlestick patterns honestly and carefully will usually make better decisions than a trader who treats them like magic signals.
References
- Fidelity Learning Center: Identifying Chart Patterns with Technical Analysis - https://www.fidelity.com/bin-public/060_www_fidelity_com/documents/learning-center/Idenitfying-Chart-Patterns.pdf
- Investopedia: Understanding Basic Candlestick Charts - https://www.investopedia.com/trading/candlestick-charting-what-is-it/
- FINRA investor protection resources - https://www.finra.org/investors
- U.S. SEC investor education resources - https://www.investor.gov/