Business Insurance: Guide to Coverage, Costs, Types & How to Choose
Support and resistance are two of the first ideas almost every forex trader learns. They sound technical, but the meaning is simple: support is an area where price has often stopped falling, and resistance is an area where price has often stopped rising. Think of them as places on a chart where buyers and sellers have previously fought strongly enough to slow, stop, or reverse price.
A beginner should not treat these areas as magic lines. A support level does not mean price must go up. A resistance level does not mean price must fall. These levels simply show where the market has reacted before. Good traders use them to plan, manage risk, and avoid chasing random moves.
In forex trading, support and resistance can appear on any currency pair: EUR/USD, GBP/USD, USD/JPY, XAU/USD, or any other market shown on a forex trading platform. The idea is the same whether you use a simple price chart, candlestick chart, or more advanced technical analysis tools.
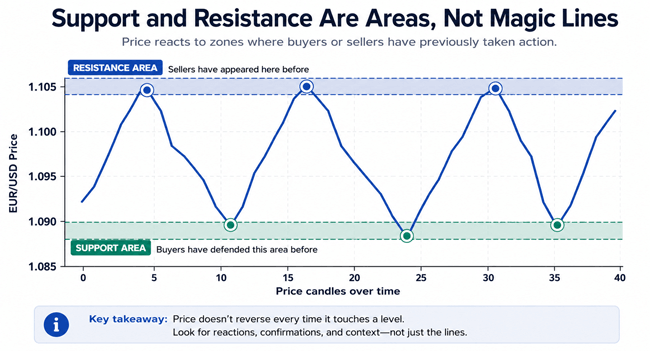
Image: support and resistance are better understood as zones where price has reacted before.
1. What Is Support in Forex?
Support is a price area where buyers have stepped in before. When price falls into support, some traders see it as “cheap enough” to buy. Others close sell positions and take profit. This buying pressure can slow the fall or push price upward.
Support is the area where price has found buyers before. It is like a floor, but not a concrete floor. It can break.
2. What Is Resistance in Forex?
Resistance is a price area where sellers have appeared before. When price rises into resistance, some traders consider it “expensive enough” to sell. Others close buy positions and take profit. This selling pressure can slow the rise or push price downward.
For example, if GBP/USD rises toward 1.2750 several times and struggles to move higher, 1.2750 becomes a resistance area. Beginners often make the mistake of drawing one thin line and expecting exact reactions. In real trading, price may poke above resistance, reject it, and then fall. This is why zones are usually more practical than single-pip lines.
Resistance is the area where price has found sellers before. It is like a ceiling, but price can break through it.
3. Why Support and Resistance Work
Support and resistance work because markets are driven by decisions, memory, orders, and emotion. When many traders remember the same area, that area can become important again. Traders who missed the earlier move may wait there. Traders who entered badly may exit there. Short-term traders may place stop losses around it. Larger traders may also build or reduce positions around obvious zones.
This is why support and resistance are not just “lines on a chart.” They represent human behaviour: fear, greed, regret, profit-taking, and risk control. A level becomes useful when enough market participants react to it.
However, support and resistance are never perfect. A news release, interest-rate surprise, inflation report, central bank speech, or sudden change in risk sentiment can break a level very quickly. That is why every support and resistance trading strategy must include risk management.
4. Support and Resistance Are Zones, Not Exact Prices
One of the most helpful lessons for a beginner is this: draw areas, not laser-thin lines. Forex prices move in pips, spreads widen, liquidity changes, and different brokers can show slightly different highs and lows. If you expect price to respect an exact number every time, you will feel confused and frustrated.
A better approach is to mark a small zone around the area where price repeatedly reacted. For example, instead of saying “support is exactly 1.0800,” you might say “support is around 1.0790 to 1.0810.” This leaves room for normal market noise.
5. How to Draw Support and Resistance Levels Step by Step
Beginners often overcomplicate this part. You do not need ten indicators to draw basic support and resistance. Start with a clean chart and follow a simple process.
- Choose a higher timeframe first, such as the daily chart or 4-hour chart. Higher timeframe levels are usually more meaningful than levels from a 1-minute chart.
- Zoom out enough to see the last few weeks or months of price action. You want context, not just the latest candle.
- Mark areas where price clearly turned more than once. Look for obvious swing highs for resistance and swing lows for support.
- Prefer clean levels that stand out quickly. If you need to force the level, it may not be important.
- Turn the line into a zone by covering the cluster of candle wicks and bodies around the reaction area.
- Check how price behaves when it returns to the zone. A level is useful only if it helps you make a better plan.
■ Types of Support and Resistance Beginners Should Know
1. Horizontal support and resistance
These are the classic levels most beginners learn first. They form when price reacts around the same area several times. Horizontal levels are easy to understand and often useful for planning entries, exits, and stop placement.
2. Trendline support and resistance
A trendline connects rising lows in an uptrend or falling highs in a downtrend. In an uptrend, the trendline may act like support. In a downtrend, it may act like resistance. Trendlines are more subjective than horizontal levels, so beginners should avoid drawing too many.
3. Dynamic support and resistance
Dynamic levels move with price. A common example is a moving average. Some traders watch the 20-period, 50-period, or 200-period moving average as a possible area where price may react. These tools can help, but they should not replace price action or risk planning.
4. Psychological levels
Round numbers such as 1.1000 on EUR/USD or 150.00 on USD/JPY often attract attention. Many traders place orders around round numbers because they are easy to remember. These levels can matter, but they work best when they also match previous price reactions.
5. Previous high and previous low
Yesterday’s high, yesterday’s low, last week’s high, and last month’s low can become important reference points. Day traders often watch these levels because price may react when liquidity is taken above or below them.
■ Support Can Become Resistance, and Resistance Can Become Support
This is one of the most practical ideas in technical analysis. When price breaks above resistance, that old resistance can later act as support. When price breaks below support, that old support can later act as resistance. Traders often call this a “role reversal.”
Why does this happen? Imagine traders sold at resistance and placed stop losses above it. When price breaks higher, sellers may exit, buyers may enter, and traders who missed the breakout may wait for a retest. That retest can create new buying pressure around the old resistance area.
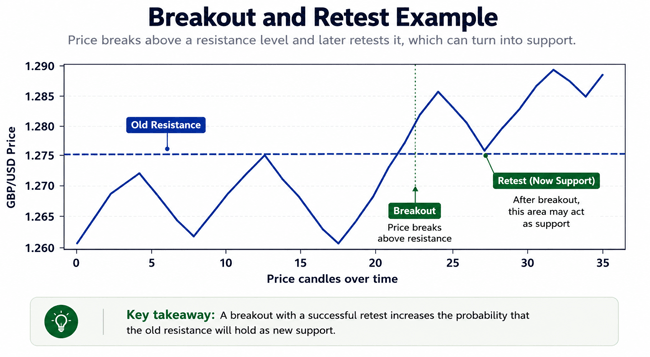
Image: after a breakout, old resistance can become new support during a retest.
■ How Beginners Can Use Support and Resistance
Support and resistance are not a full trading system by themselves. They are a map. A map tells you where important areas are, but it does not drive the car for you. A beginner can use support and resistance in several practical ways.
1. To avoid buying too high or selling too low
Many beginners enter after a big candle because they are afraid of missing out. Support and resistance help slow you down. If price is already hitting a strong resistance area, buying late may be risky. If price is already dropping into major support, selling late may be risky.
2. To plan better entries
Instead of entering randomly, a trader can wait for price to reach a level and then watch how it reacts. Does price reject the zone? Does it break through strongly? Does it retest? Waiting for evidence can reduce emotional decisions.
3. To place stop losses more logically
A stop loss should not be placed randomly. If you buy near support, your invalidation point may be below the support zone. If price breaks clearly below that zone, the reason for your trade may no longer be valid. This does not prevent losses, but it makes the loss planned rather than emotional.
4. To choose realistic profit targets
If you buy near support, the next resistance area may be a logical target. If you sell near resistance, the next support area may be a logical target. This helps beginners avoid holding every trade with unrealistic expectations.
■ Practical Example: A Beginner-Friendly Trade Plan
Imagine EUR/USD is trading near 1.0800. On the 4-hour chart, price has bounced from 1.0790 to 1.0810 three times in the past month. You mark that area as support. Price returns to the zone and forms a strong bullish rejection candle.
A beginner’s plan might look like this:
- Market: EUR/USD.
- Level: support zone around 1.0790 to 1.0810.
- Idea: buy only if price shows rejection from the support area, not simply because it touches the line.
- Entry: after a confirming candle closes, or after a small pullback if the trader has a tested rule.
- Stop loss: below the support zone, where the trade idea is clearly wrong.
- Target: the next resistance zone, for example 1.0900 to 1.0920.
- Risk: no more than a small fixed percentage of the account, such as 0.5% or 1%, depending on the trader’s experience and rules.
This example does not promise profit. The trade can still fail. The point is that support and resistance help the trader define the idea, risk, and target before entering.
■ Breakout Trading vs Bounce Trading
Most support and resistance strategies fall into two simple categories: bounce trading and breakout trading. Beginners should understand the difference before using either method.
| Approach | What it means | Beginner advantage | Main risk |
|---|---|---|---|
| Bounce trading | Buying near support or selling near resistance after price rejects the zone. | Easy to understand and gives clear invalidation areas. | The level may break, especially during strong trends or news. |
| Breakout trading | Entering after price breaks through support or resistance. | Can catch strong moves when momentum is real. | False breakouts are common; entering too early can be painful. |
| Breakout and retest | Waiting for price to break a level and then return to test it before entering. | More patient and often clearer than chasing the first breakout candle. | Retests may never happen, or price may retest and still fail. |
6. False Breakouts: The Beginner Trap
A false breakout happens when price moves above resistance or below support, attracts traders into the breakout, and then quickly returns back inside the old range. This is common in forex because liquidity often sits just beyond obvious highs and lows.
Beginners often buy the moment price breaks resistance, only to see the market reverse. To reduce this problem, many traders wait for a candle close beyond the level, a retest, or confirmation from market context. Even then, false breakouts can still happen.
7. How to Tell If a Level Is Strong or Weak
Not all support and resistance levels are equal. A level becomes more useful when it is clear, repeated, and connected to market context. Beginners can judge a level with these questions:
- Has price reacted from this area more than once?
- Did the reaction create a strong move, or was it small and messy?
- Is the level visible on a higher timeframe?
- Does the level match a round number, previous high, previous low, or trendline?
- Is price approaching the level slowly, or is it rushing into it with strong momentum?
- Is there major news coming soon that could make the level unreliable?
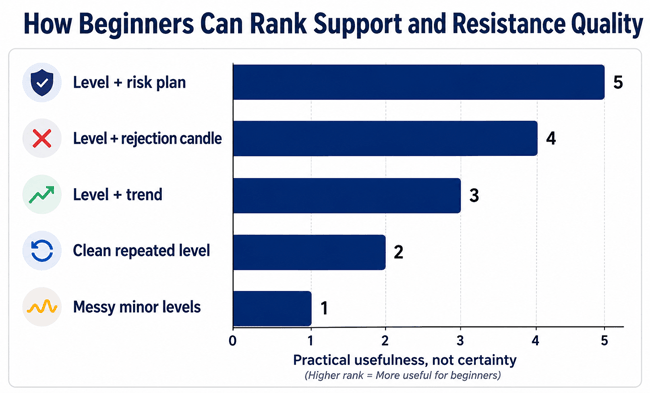
Image: A simple way to think about level quality: combine clarity, context, confirmation, and risk planning.
■ Common Mistakes Beginners Make
1. Drawing too many levels
If your chart looks like a barcode, it will not help you trade. Too many levels create confusion. Mark only the clearest zones and remove levels that no longer matter.
2. Ignoring the higher timeframe
A 5-minute support level may work for a quick trade, but it can fail easily if the daily chart is pushing strongly in the opposite direction. Beginners should start analysis from higher timeframes and then move down if needed.
3. Assuming support and resistance always hold
Levels break. In fact, strong trends are created when levels keep breaking. A trader who refuses to accept this can turn a small loss into a large loss.
4. Placing stops too close
If a stop loss is placed exactly on the support line, normal market noise may stop the trade before the idea has truly failed. Stops need breathing room, but more room also means position size must be reduced.
5. Risking too much on one trade
Support and resistance do not remove risk. A beginner who risks 10% or 20% of an account on one setup is not trading responsibly. Small, planned risk gives you the chance to learn without one mistake destroying the account.
6. Following social media signals blindly
A chart shared online may look convincing, but it may not match your broker spread, timeframe, account size, risk tolerance, or trading plan. Trading education can help, but copying trades without understanding them is dangerous.
■ Support and Resistance With Risk Management
The best support and resistance analysis is useless without risk management. A trader can be right about the level and still lose money if the stop is too large, the position size is too big, or the spread is ignored.
A practical beginner framework is the “idea, invalidation, target, risk” method:
- Idea: Why might price react here?
- Invalidation: What price action proves the idea wrong?
- Target: Where is the next logical area price may reach?
- Risk: How much money can I lose if I am wrong?
For example, if you buy near support, the invalidation may be a clean break below that support. Your target may be the next resistance. Your risk should be small enough that losing does not create panic or revenge trading.
■ How Support and Resistance Fit Into a Complete Forex Trading Strategy
A complete forex trading strategy needs more than levels. Support and resistance answer the question “where?” But a trader also needs to answer “when?”, “why?”, and “how much?”
- Where: the support or resistance zone.
- When: after price gives a clear reaction, breakout, retest, or candle close based on your rules.
- Why: the level matches trend, structure, market session, or a clear price action setup.
- How much: position size based on stop loss distance and account risk.
This is why many traders combine support and resistance with trend analysis, candlestick patterns, session timing, economic calendar awareness, and a trading journal. The goal is not to predict every move. The goal is to make consistent decisions.
■ Support and Resistance vs Supply and Demand
Beginners often ask whether support and resistance are the same as supply and demand zones. They are related, but not always identical. Support and resistance usually refer to visible chart levels where price reacted. Supply and demand zones often focus on where strong institutional buying or selling may have started.
| Concept | Simple meaning | Best beginner use |
|---|---|---|
| Support | Area where price has found buyers before. | Planning possible buy zones or profit targets for sell trades. |
| Resistance | Area where price has found sellers before. | Planning possible sell zones or profit targets for buy trades. |
| Supply zone | Area where strong selling may have started. | Understanding potential selling pressure above price. |
| Demand zone | Area where strong buying may have started. | Understanding potential buying pressure below price. |
■ Best Timeframes for Beginners
Beginners often start on very low timeframes because they want fast results. This usually creates stress. The 1-minute and 5-minute charts can be noisy, especially for new traders. Higher timeframes such as the daily, 4-hour, and 1-hour charts often make support and resistance easier to see.
A practical beginner routine is to mark major levels on the daily chart, refine them on the 4-hour chart, and use the 1-hour chart for planning. Day traders may go lower, but only after they understand spread, volatility, session timing, and position sizing.
■ How News Affects Support and Resistance
Forex is strongly affected by macroeconomic news: interest rate decisions, inflation data, employment reports, central bank speeches, GDP releases, and geopolitical events. During major news, price can break through support or resistance with little respect for old levels.
Beginners should check an economic calendar before trading. If a major event is minutes away, technical levels may become unreliable. Many experienced traders either reduce risk, avoid new trades, or wait until volatility settles.
■ Choosing Tools: Broker, Platform, and Chart Setup
Support and resistance can be drawn on almost any forex trading platform. Beginners do not need expensive tools to start. A clean candlestick chart, drawing tools, and an economic calendar are enough for learning. What matters more is choosing a regulated forex broker, understanding spreads and fees, and practising on a demo account before using real money.
High-quality trading education, a responsible online trading course, or a mentor can help if they teach risk management and realistic expectations. Be careful with any forex course, signal group, or managed account service that uses phrases like guaranteed profit, risk-free income, secret bank strategy, or daily returns.
■ A Simple Beginner Exercise
Use this exercise to practise without risking money:
- Open a demo account or charting platform.
- Choose one major pair, such as EUR/USD or GBP/USD.
- Go to the daily chart and mark the three clearest support and resistance zones.
- Move to the 4-hour chart and see whether price respected those zones.
- Write down what happened when price returned to each level: bounce, breakout, false breakout, or no reaction.
- Do this for at least 20 examples before considering any live trade.
This kind of practice builds real chart experience. It is more useful than memorising definitions because you learn how messy the market can be.
■ Beginner Checklist Before Using a Support or Resistance Trade
- Is the level clear on a higher timeframe?
- Is it a zone, not a single exact line?
- Has price reacted there before?
- Am I trading with a plan, or am I chasing?
- Where is my stop loss if the idea is wrong?
- Where is my realistic target?
- Is the reward worth the risk?
- Is there major news soon?
- Is my position size small enough?
- Have I written the trade in my journal?
■ Frequently Asked Questions
1. Is support and resistance good for beginners?
Yes, because it teaches beginners to read market structure and plan trades around important areas. But it should be used with risk management, not as a stand-alone promise of profit.
2. How many times should price touch a level?
Two clear reactions can be enough to mark a level. Three or more reactions may make it more visible, but too many touches can also weaken a level because orders around it may be consumed.
3. Which timeframe is best for support and resistance?
For beginners, the daily and 4-hour charts are often easier to read. Lower timeframes can be used later, but they create more false signals and emotional pressure.
4. Should I use indicators with support and resistance?
Indicators can help, but they are not required. Many traders use moving averages, RSI, or volume-related tools for extra context. The level, price reaction, and risk plan are more important than adding many indicators.
5. Can support and resistance predict the market?
No. They do not predict with certainty. They highlight areas where price may react. A professional mindset is to think in probabilities, not guarantees.
6. What is the biggest beginner mistake?
The biggest mistake is believing a level must hold. The market owes you nothing. Always decide in advance where you are wrong and how much you are willing to lose.
■ Final Thoughts
Support and resistance are simple, but not simplistic. They help beginners understand where buyers and sellers have reacted before, where trades may be planned, and where risk can be controlled. The real skill is not drawing perfect lines. The real skill is waiting patiently, accepting uncertainty, and managing risk when the market does something unexpected.
For a beginner, the best path is to study one or two currency pairs, practise on a demo account, keep charts clean, record examples, and avoid anyone promising easy forex income. Support and resistance can become a powerful part of your forex trading strategy, but only when combined with honest expectations, careful risk management, and consistent practice.
Sources Used
- CFTC: Foreign Currency Trading; retail forex risk disclosure and fraud alerts.
- Investor.gov: Foreign Currency Exchange (Forex) Trading for Individual Investors; leverage risk.
- FCA: Contract for differences and leveraged rolling spot forex risk warning guidance.
Reader Advice: This article is provided for educational and informational purposes only and should not be considered financial, investment, or trading advice. Forex trading involves risk. Before making any trading decisions, take the time to study the forex market thoroughly, understand the risks, and evaluate whether trading is appropriate for your financial situation and experience. Always make informed decisions based on your own research, and consider seeking guidance from a qualified financial professional when needed.