Forex Reversal Chart Patterns: 8 Trend Reversal Patterns Every Beginner Should Know
1. What is a trend reversal in forex?
A trend reversal means the market changes direction. In a bullish trend, price has been making higher highs and higher lows. A bearish reversal happens when buyers lose strength and sellers start controlling the next move. In a bearish trend, price has been making lower highs and lower lows. A bullish reversal happens when sellers lose strength and buyers begin pushing price upward.
Forex traders watch reversal chart patterns because currency pairs often move in waves. The euro may rise against the U.S. dollar for several sessions, then stall near resistance. The British pound may fall after weak economic data, then stop falling when sellers become exhausted. A chart pattern gives a visual shape to that change in pressure.
A beginner should remember this simple idea: a reversal pattern is not the reason price turns. It is a footprint left by traders reacting to news, liquidity, interest-rate expectations, central-bank comments, support and resistance, and risk sentiment.
The goal here is not to make reversal patterns sound magical. The goal is to show how experienced traders usually think about them: context first, confirmation second, risk control always.
2. How reversal chart patterns work in real trading
Most reversal patterns work through the same basic story. First, the market has an existing trend. Second, the trend starts slowing down. Third, price fails to continue in the same direction. Fourth, price breaks an important level, such as support, resistance, a neckline, or a trendline. That break is the point where many traders begin treating the old trend as damaged.
For example, imagine EUR/USD has been rising for days. Buyers keep entering every dip. Then price reaches a major resistance zone and forms two similar highs. The second push higher fails. When price drops below the support between the two highs, traders call it a double top. The pattern matters because it shows that buyers tried twice and could not continue the uptrend.
The best traders do not only ask, “What pattern is this?” They ask better questions: Where is it forming? Is the market already extended? Is there a key support or resistance level nearby? Is volatility normal or wild? Is there a major news release coming? Is the risk-to-reward worth taking?
3. The beginner’s rule: pattern + location + confirmation
A pattern in the middle of a messy sideways chart is often weak. A pattern at a major support or resistance area is usually more meaningful. This is why many experienced forex traders use a three-part filter:
- Pattern: a recognizable reversal structure forms on the chart.
- Location: the pattern appears near support, resistance, a supply or demand zone, a previous swing point, or an important moving average area.
- Confirmation: price breaks the key level, closes beyond it, retests it, or shows supporting volume/volatility behavior depending on the platform and market data available.
This filter helps beginners avoid the common mistake of forcing a pattern onto every small price wiggle.
■ Most useful forex reversal chart patterns
1. Head and shoulders: a classic bearish reversal pattern
The head and shoulders pattern usually appears after an uptrend. It has three peaks: a left shoulder, a higher middle peak called the head, and a right shoulder that fails to reach the same height as the head. A support line drawn under the pullbacks is called the neckline. Many traders treat a break below the neckline as the signal that the uptrend may be reversing.
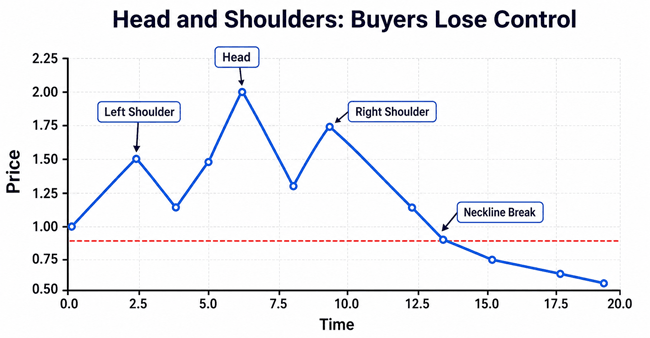
Figure 1: A simplified head and shoulders pattern. The key moment is not the shape itself; it is the break of the neckline after buyers fail to make a stronger high.
Example: suppose GBP/USD rises during the London session, pulls back, makes a stronger high, then fails on the next rally. If the pair breaks the neckline while the U.S. dollar is also strengthening across the market, the bearish reversal idea becomes more believable. A cautious trader may wait for a candle close below the neckline instead of entering during the first spike.
Beginner tip: the right shoulder does not need to be perfect. Real forex charts are messy. Focus on the story: buyers made a final attempt, failed, and then support broke.
2. Inverse head and shoulders: a bullish reversal pattern
The inverse head and shoulders is the upside-down version of the head and shoulders. It usually appears after a downtrend. It has a left shoulder, a lower middle low called the head, and a right shoulder that fails to make a new low. When price breaks above the neckline, traders may see it as a sign that sellers are losing control.
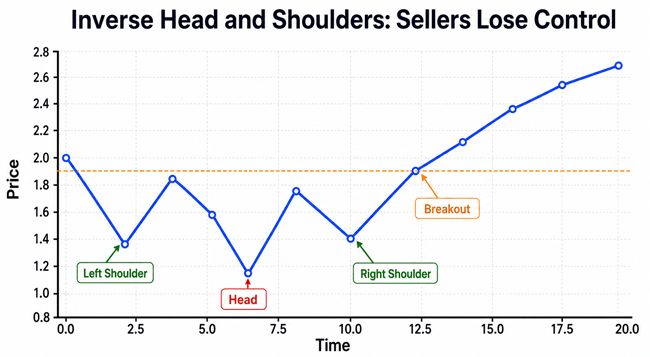
Figure 2: A simplified inverse head and shoulders pattern. The strongest signal comes when price breaks above the neckline and holds above it.
Example: USD/JPY has been falling, but each new low attracts buyers faster than before. After the right shoulder forms, price pushes above the neckline. A beginner could mark the neckline, wait for a retest, and only consider a trade if the stop-loss can be placed logically below the right shoulder with acceptable risk.
3. Double top: two failed attempts to rise
A double top is a bearish reversal pattern. It forms when price reaches a resistance area, pulls back, rises again, and fails near the same area. The support between the two highs is the trigger level. A break below that support suggests the previous uptrend may be turning down.
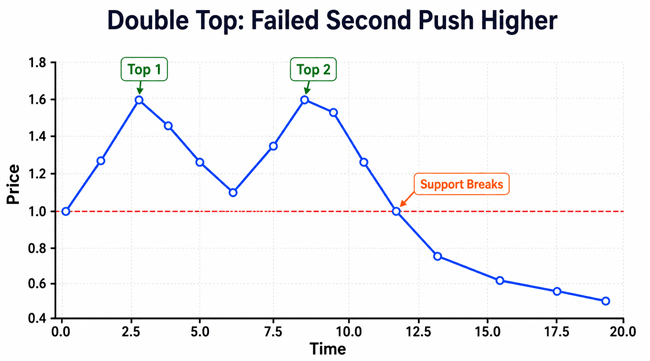
Figure 3: A simplified double top. The second top shows that buyers could not push through resistance, and the support break confirms weakness.
A common beginner mistake is entering short as soon as the second top appears. That can be early. Price may still break upward and continue the trend. The more patient approach is to wait for support to break, then judge whether the trade still offers a good reward compared with the stop distance.
4. Double bottom: two failed attempts to fall
A double bottom is a bullish reversal pattern. It forms after a downtrend when price tests a support area twice and fails to break lower. The resistance between the two lows is the trigger level. When price breaks above that resistance, buyers may be taking control.
Example: AUD/USD falls into a daily support zone. The first bounce is weak, but the second test refuses to make a lower low. If price breaks above the middle resistance, a beginner may plan a long setup with a stop below the second bottom. The trade is stronger if the broader market also supports the idea, such as improving risk sentiment or weaker U.S. dollar momentum.
5. Triple top and triple bottom: stronger but slower patterns
A triple top is similar to a double top, but price fails three times near resistance. A triple bottom is similar to a double bottom, but price holds support three times. These patterns can be powerful because they show repeated failure. However, they also take longer to form, and by the time they break, part of the move may already be gone.
The practical lesson is patience. A beginner should not assume the third test must reverse. Sometimes the market tests a level multiple times because it is preparing to break through it. The trigger level still matters.
6. Rounding top and rounding bottom: slow trend exhaustion
A rounding top looks like price slowly bends from an uptrend into a downtrend. A rounding bottom looks like price slowly bends from a downtrend into an uptrend. These patterns are common on higher timeframes because institutional positioning and macro expectations often change gradually.
They are less dramatic than a head and shoulders pattern, but they can be useful for swing traders. The signal is usually stronger when price breaks a clear horizontal level after the rounded shape forms.
7. Wedge reversal patterns
A rising wedge can become a bearish reversal pattern when price keeps rising but with weaker momentum. The highs and lows compress upward until support breaks. A falling wedge can become a bullish reversal pattern when price keeps falling but selling pressure weakens and resistance breaks.
Wedges are easy to misuse. Many beginners draw wedge lines after the fact. To make them practical, use at least two touches on each side, avoid forcing the lines, and wait for a clear break rather than guessing inside the wedge.
8. Candlestick reversal patterns that support chart patterns
Candlestick patterns can support a larger chart pattern. Examples include pin bars, engulfing candles, morning stars, evening stars, hammers, and shooting stars. On their own, they are often too small to trust. At a major support or resistance level, they can add useful confirmation.
For instance, a double bottom at daily support becomes more interesting if the second bottom forms a bullish engulfing candle. A head and shoulders pattern becomes more convincing if the right shoulder forms a bearish rejection candle near resistance.
■ Quick comparison of major reversal patterns
| Pattern | Direction | Best location | Confirmation | Beginner warning |
|---|---|---|---|---|
| Head and shoulders | Bearish | After uptrend near resistance | Close below neckline | Do not enter before neckline break |
| Inverse head and shoulders | Bullish | After downtrend near support | Close above neckline | Right shoulder may be uneven |
| Double top | Bearish | Strong resistance zone | Break below middle support | Second top alone is not enough |
| Double bottom | Bullish | Strong support zone | Break above middle resistance | Avoid buying just because price touched support twice |
| Rising wedge | Bearish | Late uptrend or weak rally | Break below wedge support | Forced trendlines create false signals |
| Falling wedge | Bullish | Late downtrend or weak selloff | Break above wedge resistance | Can keep falling longer than expected |
4. How beginners can actually use reversal patterns
A simple trading process is better than memorizing twenty patterns. Here is a beginner-friendly workflow:
- Start with the higher timeframe. If you trade the 15-minute chart, check the 1-hour and 4-hour charts first. A reversal pattern against a strong higher-timeframe trend needs more caution.
- Mark obvious support and resistance. Use swing highs, swing lows, round numbers, and previous reaction zones. Keep the chart clean.
- Wait for the pattern to complete. Most reversal patterns are not complete until the trigger level breaks.
- Plan the trade before entering. Decide entry, stop-loss, target, and maximum risk. If the stop is too wide, skip the trade or reduce position size.
- Look for a retest when possible. Many traders wait for price to break the neckline or support/resistance level, then retest it from the other side.
- Record the result. A trading journal helps you learn which patterns work best for your timeframe and currency pairs.
5. Practical trade example: double top on EUR/USD
Imagine EUR/USD has been trending upward on the 1-hour chart. Price reaches 1.0920, falls to 1.0870, rallies again to 1.0915, and then starts dropping. You now have two similar highs and a middle support around 1.0870.
A beginner-friendly plan could look like this:
- Pattern: possible double top after an uptrend.
- Trigger: wait for a 1-hour candle close below 1.0870.
- Entry idea: short after the close or after a retest of 1.0870 as resistance.
- Stop-loss idea: above the second top, or above the retest high if using a tighter plan.
- Target idea: previous support area, or a measured move equal to the distance from the top to the neckline.
- Risk rule: risk only a small fixed percentage of the account, such as 0.5% to 1%, depending on personal tolerance and experience.
This example is not a recommendation to trade EUR/USD. It simply shows how a pattern becomes a plan. The plan is useful because it defines what must happen before entry and where the idea is wrong.
6. The role of risk management
Risk management matters more than pattern names. A trader can be right about direction and still lose money if the stop is too tight, position size is too large, or news volatility causes slippage. A trader can also be wrong often and still survive if losses are small and controlled.
Practical risk habits beginners should build:
- Use a stop-loss on every planned trade.
- Avoid moving the stop farther away because you feel hopeful.
- Do not increase lot size after a loss to “win it back.”
- Avoid trading directly before major news unless you understand the risk.
- Check spread and liquidity, especially around market open, rollover, and high-impact events.
- Think in probabilities, not certainty. A good setup can still lose.
■ Common mistakes beginners make with reversal patterns
1. Seeing patterns everywhere
When traders learn chart patterns, they often start finding them on every chart. This leads to forced trades. Use location and confirmation to filter weak setups.
2. Ignoring the main trend
A tiny reversal pattern against a strong daily trend may fail quickly. Always check the bigger picture.
3. Entering before the break
Many patterns fail before confirmation. Waiting may reduce the number of trades but can improve decision quality.
4. Using the same stop for every pattern
The stop should match the structure. A double bottom stop often goes below the second low. A head and shoulders stop may go above the right shoulder or above a retest high.
5. Forgetting news and sessions
Forex moves differently during Asian, London, and New York sessions. High-impact economic news can break patterns in both directions.
6. Believing a pattern guarantees profit
No pattern has a 100% win rate. The professional approach is to manage risk and collect data from repeated trades.
■ Best timeframes for forex reversal patterns
Higher timeframes usually produce cleaner patterns, but they also require wider stops and more patience. Lower timeframes produce more signals, but they also create more noise and false breaks.
| Timeframe | Best for | Pros | Cons |
|---|---|---|---|
| 5–15 minutes | Scalpers | Many setups, fast feedback | More noise, spreads matter more |
| 1 hour | Intraday traders | Balanced detail and structure | Can be affected by session changes |
| 4 hours | Swing traders | Cleaner patterns, fewer false signals | Requires patience and wider stops |
| Daily | Position/swing traders | Strong context, less screen time | Trades take longer to develop |
7. What indicators can help confirm a reversal?
Indicators should not replace price structure, but they can help confirm what the chart is already suggesting. Keep the toolset simple.
- Moving averages: useful for seeing whether price is stretched or beginning to cross back through an average.
- RSI: can show momentum divergence, such as price making a higher high while RSI makes a lower high.
- MACD: can help spot momentum shifts, but it often reacts late.
- ATR: helps estimate normal volatility and place stops with more breathing room.
- Volume or tick volume: spot forex volume is not centralized, but platform tick volume can still sometimes show activity changes.
A practical rule: use one or two confirmation tools at most. Too many indicators can create confusion and make you miss the actual price action.
■ FAQ: beginner questions about forex reversal chart patterns
1. What is the most reliable reversal pattern in forex?
There is no single most reliable pattern in every market. Head and shoulders, inverse head and shoulders, double tops, and double bottoms are widely watched, but reliability depends on location, timeframe, confirmation, and risk management.
2. Can beginners trade reversal patterns?
Beginners can study them, backtest them, and practice on a demo account. Live trading should be approached slowly because reversals often fail and forex leverage can increase losses.
3. Should I trade the pattern before the breakout?
Most beginners are better served by waiting for confirmation. Early entries can offer better prices but also fail more often.
4. Do reversal patterns work on all currency pairs?
They can appear on all pairs, but behavior differs. Major pairs often have tighter spreads and more liquidity. Exotic pairs may move sharply and have wider spreads.
5. How many patterns should I learn first?
Start with four: head and shoulders, inverse head and shoulders, double top, and double bottom. Learn them deeply before adding wedges, triples, and candlestick combinations.
6. What is the biggest danger with reversal trading?
Trying to catch the exact top or bottom. It is usually safer to wait until the market proves that the old trend is weakening.
■ Conclusion: the honest way to read reversal patterns
Chart patterns that signal trend reversals in forex trading are useful because they turn market behavior into a structure beginners can understand. They show where buyers or sellers may be losing control. But they are not signals to trade blindly.
The practical approach is simple: identify the trend, mark key levels, wait for the pattern to complete, confirm the break, plan the risk, and record the result. Over time, the trader learns which setups fit their personality, schedule, and risk tolerance.
A clean chart, a patient mind, and strict risk management are more valuable than chasing every pattern. In forex trading, survival comes before profit, and honest practice is what gives a beginner the best chance to improve.
Reader Advice: This article is provided for educational and informational purposes only and should not be considered financial, investment, or trading advice. Forex trading involves risk. Before making any trading decisions, take the time to study the forex market thoroughly, understand the risks, and evaluate whether trading is appropriate for your financial situation and experience. Always make informed decisions based on your own research, and consider seeking guidance from a qualified financial professional when needed.