Candlestick Patterns Explained for Beginners
1. What Candlestick Patterns Really Tell You
Candlestick patterns are a visual way to understand what happened between buyers and sellers during a chosen time period. A single candle may represent one minute, one hour, one day, or one week. Instead of showing only the closing price, a candlestick shows four useful prices: the open, high, low, and close. That small shape can reveal whether buyers were strong, sellers were in control, or the market was confused.
For a complete beginner, the easiest way to think about candlesticks is this: each candle is a short story of a price battle. The body shows where the battle started and ended. The wick shows how far price traveled before being pushed back. Patterns are simply repeated stories that traders have learned to watch because they can sometimes appear near turning points, pullbacks, breakouts, and moments of hesitation.
But candlestick patterns are not magic signals. A hammer does not automatically mean buy. A bearish engulfing candle does not automatically mean sell. Experienced traders usually treat patterns as clues, not commands. They combine them with trend direction, support and resistance, market news, volume, and a written risk plan.
2. What Is a Candlestick Chart?
A candlestick chart is a price chart made of candles. Each candle summarizes price movement for one selected time frame. On a daily stock chart, one candle equals one trading day. On a 15-minute forex or crypto chart, one candle equals 15 minutes. The time frame changes, but the candle logic remains the same.
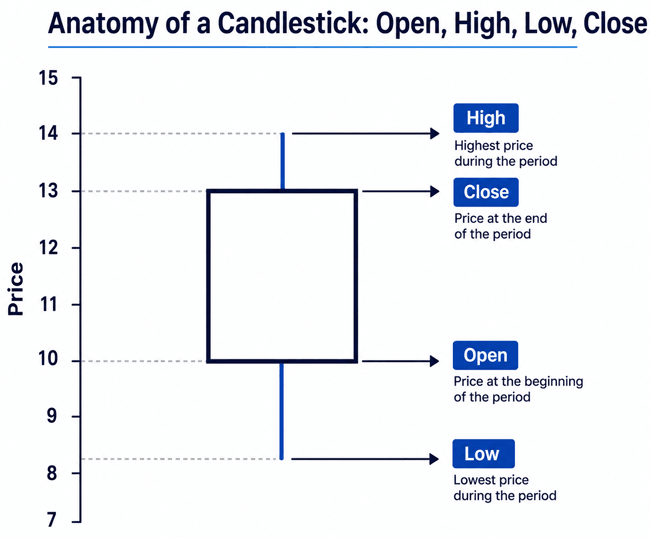
Figure 1. The basic parts of a candlestick: open, high, low, close, body, and wick.
The Four Prices Inside Every Candle
- Open: the first traded price in that candle period.
- High: the highest price reached during the period.
- Low: the lowest price reached during the period.
- Close: the final traded price before the candle completed.
If the close is higher than the open, the candle is usually shown as bullish. If the close is lower than the open, it is usually shown as bearish. Different trading platforms use different colors, often green/white for bullish candles and red/black for bearish candles. The color matters less than the relationship between open and close.
3. How Candlestick Patterns Work
Candlestick patterns work by showing changes in pressure. If price falls all day but then buyers push it back near the open, the wick tells you sellers lost some control. If a large bullish candle completely covers the body of the previous bearish candle, it suggests buyers may have taken control with more force than before. This is why candlestick trading is often called price action trading: you are reading what price is doing, not only what an indicator says.
The most practical way to read a candle is to ask three questions: Where did price open? How far did it move? Where did it close? A strong close near the high usually shows buyer strength. A weak close near the low usually shows seller strength. A tiny body with long wicks often shows indecision or rejection.
■ Single-Candle Patterns Beginners Should Know
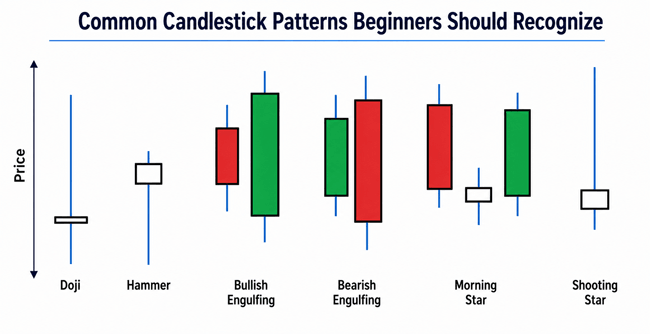
Figure 2. Common candlestick patterns used by beginners and active traders.
1. Doji: Indecision, Not a Guaranteed Reversal
A doji forms when the open and close are almost the same. It means the market moved during the candle, but neither buyers nor sellers finished with a clear victory. Beginners often think every doji means a reversal. That is too simple. A doji after a long trend can warn that momentum is slowing, but a doji in the middle of a sideways market may mean very little.
2. Hammer: Rejection of Lower Prices
A hammer has a small real body near the top of the candle and a long lower wick. It usually appears after a decline. The long lower wick shows that sellers pushed price down, but buyers stepped in and lifted price before the candle closed. That does not prove a new uptrend has started, but it can show that lower prices were rejected.
Many real traders prefer to see a hammer at support, near a moving average, or after an oversold move. A hammer floating randomly in the middle of a chart is weaker than a hammer that appears where buyers have defended price before.
3. Shooting Star: Rejection of Higher Prices
A shooting star is like the opposite of a hammer. It has a small body near the bottom and a long upper wick. It often appears after a rally. The wick says buyers tried to push price higher, but sellers pushed it back down before the candle closed. Traders watch this near resistance or after a fast upward move.
4. Spinning Top: Small Body, Mixed Message
A spinning top has a small body and wicks on both sides. It often means the market moved up and down but finished without a clear winner. It is less dramatic than a hammer or engulfing pattern, but it can still be useful when it appears after an extended trend.
■ Two-Candle Patterns That Beginners Often Use
1. Bullish Engulfing Pattern
A bullish engulfing pattern appears when a bearish candle is followed by a larger bullish candle whose body covers, or engulfs, the previous candle body. It is usually watched after a downtrend or pullback. The idea is simple: sellers controlled the first candle, but buyers came back with enough strength to erase that candle and close higher.
A beginner-friendly trading example: price pulls back to a support zone on a daily chart. A small red candle forms. The next day opens slightly lower but closes strongly above the previous candle's open. That creates a bullish engulfing pattern. A cautious trader may wait for price to break above the engulfing candle high before entering, and they may place a stop-loss below the pattern low. This is not a recommendation; it is an example of how traders structure a plan.
2. Bearish Engulfing Pattern
A bearish engulfing pattern appears when a bullish candle is followed by a larger bearish candle that covers the previous candle body. It is watched after an uptrend or rally into resistance. It suggests buyers were in control first, but sellers took over strongly by the close.
The mistake beginners make is selling every bearish engulfing candle they see. In a strong uptrend, bearish candles can fail quickly. Context matters. A bearish engulfing pattern near major resistance, after weak volume on the rally, and with a broader market turning down is more meaningful than the same pattern in the middle of a strong bullish breakout.
■ Three-Candle Patterns: Stronger Story, Still Not Perfect
1. Morning Star
A morning star is a three-candle bullish reversal pattern. It often appears after a decline. The first candle is bearish, the second candle is small and shows hesitation, and the third candle is bullish. The pattern tells a story: sellers were strong, then momentum paused, then buyers took control.
2. Evening Star
An evening star is the bearish version. It appears after a rise: a bullish candle, then a small hesitation candle, then a bearish candle. Traders watch it near resistance or after an overextended move.
3. Three White Soldiers and Three Black Crows
Three white soldiers are three strong bullish candles in a row. Three black crows are three strong bearish candles in a row. These patterns show momentum, but beginners should avoid chasing them blindly. After three large candles, price may already be extended. Waiting for a pullback often provides a cleaner risk-to-reward setup.
The Most Important Rule: Pattern + Context + Confirmation
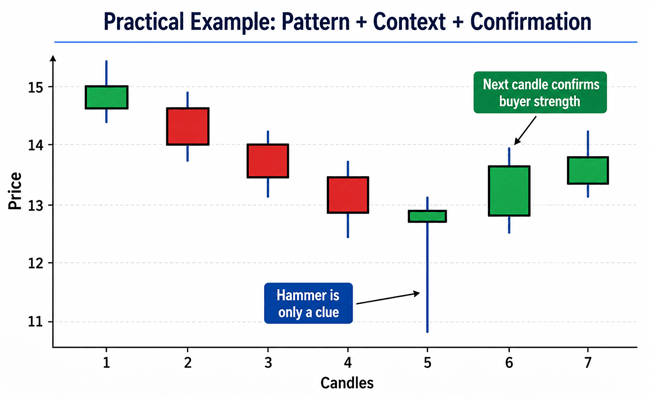
Figure 3. A practical sequence: downtrend, hammer clue, confirmation candle.
The difference between a beginner and a more experienced trader is often not the number of patterns they know. It is how they judge context. A pattern is more useful when it appears at an important place on the chart and is followed by confirmation.
- Trend: Is price generally moving up, down, or sideways?
- Location: Is the pattern near support, resistance, a trendline, or a key moving average?
- Volume: Did the pattern form with stronger-than-usual activity?
- Confirmation: Did the next candle support the pattern idea?
- Risk: Is there a logical stop-loss level, and is the possible reward worth the risk?
4. Candlestick Patterns Compared: What They Mean in Simple Words
| Pattern | Typical message | Best location | Beginner caution |
|---|---|---|---|
| Doji | Indecision or balance | After a strong trend or at a key level | Not every doji matters. |
| Hammer | Lower prices rejected | After a decline, near support | Needs confirmation. |
| Shooting star | Higher prices rejected | After a rally, near resistance | Can fail in strong uptrends. |
| Bullish engulfing | Buyers overpower sellers | Downtrend pullback or support | Avoid using it in random sideways noise. |
| Bearish engulfing | Sellers overpower buyers | Uptrend rally or resistance | Avoid shorting strong bull trends blindly. |
| Morning star | Selling slows, buyers return | After a decline | The third candle should show real strength. |
| Evening star | Buying slows, sellers return | After a rise | Works better with resistance and overall context. |
5. How Beginners Can Use Candlestick Patterns Step by Step
- Choose one market first. Do not jump between stocks, forex, crypto, options, and commodities at the same time. Each market behaves differently.
- Choose one time frame for learning. Daily charts are often easier for beginners because they contain less noise than one-minute charts.
- Mark the trend. Use higher highs and higher lows for uptrends, lower highs and lower lows for downtrends, and flat swings for sideways markets.
- Mark support and resistance. Candlestick patterns near these areas are usually more useful than patterns in empty space.
- Wait for a familiar pattern. Start with doji, hammer, shooting star, bullish engulfing, and bearish engulfing before learning rare patterns.
- Look for confirmation. Let the next candle prove that buyers or sellers are actually following through.
- Plan risk before entry. Decide where the trade idea is wrong before thinking about profit.
- Journal every trade or paper-trade. Write down the pattern, context, entry, exit, and lesson.
6. Practical Example: Reading a Bullish Engulfing Setup
Imagine a stock has been in a larger uptrend, but it pulls back for four days. Price reaches an old support zone around $50. On day five, a small bearish candle closes at $49.70. On day six, price opens at $49.50 but buyers push it up all day and it closes at $51.20. The day-six candle engulfs the body of the day-five candle.
A beginner may think, 'This is bullish, so I should buy now.' A more careful trader thinks, 'This is a clue. I need a plan.' A simple educational plan might be: enter only if price breaks above $51.20, place a stop below the pattern low around $49.40, and avoid the trade if the risk is too large compared with the nearest resistance. This is how candlestick patterns become practical: they help define a possible entry, invalidation point, and trade story.
7. Practical Example: Reading a Bearish Rejection
Now imagine a crypto asset rallies quickly from $80 to $110 and reaches a resistance area where it failed before. A shooting star forms: price trades as high as $114 but closes near $107. The next candle closes below the shooting star low. That confirmation suggests sellers may be gaining control.
A risk-aware trader still does not assume a crash is guaranteed. They may reduce exposure, wait for a pullback, or paper-trade the setup. In fast markets like crypto trading or forex trading, false breakouts and sudden reversals are common, so position size and stop-loss discipline matter more than the pattern name.
8. Common Beginner Mistakes with Candlestick Patterns
- Memorizing pattern names without understanding the buyer-seller story.
- Trading patterns without checking trend, support, resistance, or market conditions.
- Entering too early before confirmation.
- Using very low time frames where candles are noisy and spread/fees matter more.
- Risking too much because a pattern looks 'perfect.'
- Ignoring news, earnings, interest-rate decisions, or broader market volatility.
- Assuming a pattern has the same reliability in stocks, forex, crypto, and options.
- Backtesting visually with hindsight instead of recording rules honestly.
9. Candlestick Patterns vs Indicators
| Tool | What it helps with | Limitation |
|---|---|---|
| Candlestick patterns | Reading immediate price behavior and rejection. | Can create false signals without context. |
| Moving averages | Seeing trend direction and dynamic support/resistance. | Lag behind price. |
| RSI or stochastic | Spotting overbought and oversold conditions. | Can stay overbought or oversold for a long time. |
| Volume | Checking whether participation supports the move. | Volume interpretation varies by market. |
| Support/resistance | Finding meaningful locations for patterns. | Levels are zones, not exact lines. |
The best approach is not candlesticks versus indicators. It is candlesticks plus context. A bullish engulfing candle at support with rising volume and an improving market is a stronger story than a bullish engulfing candle in the middle of a random sideways range.
10. Do Candlestick Patterns Work in Stocks, Forex, Crypto, and Options?
Candlesticks can be used in many markets because all liquid markets have open, high, low, and close data. However, the way patterns behave can differ. Stock charts are affected by earnings, market hours, gaps, and sector news. Forex trading runs almost 24 hours during the business week, so gaps may be less common except around weekends or major news. Crypto trading is open around the clock and can be highly volatile. Options add extra complexity because option prices depend not only on direction but also volatility, time decay, and liquidity.
11. Risk Management: The Part Most Candlestick Articles Underteach
A good pattern with poor risk management can still become a bad trade. Many people lose money not because they cannot spot a hammer, but because they risk too much, move stop-losses, chase entries, or trade during emotional market conditions. Candlestick patterns should support a risk plan, not replace one.
- Use small position sizes while learning.
- Never risk money needed for rent, bills, debt payments, or emergency savings.
- Decide the invalidation point before entering.
- Avoid adding to losing trades just because another candle looks hopeful.
- Paper-trade or backtest before using real capital.
- Treat any trading course, paid signal service, or technical analysis software with healthy skepticism if it promises easy profits.
13. A Simple Candlestick Checklist for Beginners
- What is the overall trend?
- Where is the nearest support or resistance?
- What pattern do I see, and what buyer-seller story does it tell?
- Did the candle close strongly or weakly?
- Is there confirmation from the next candle?
- Is volume supporting the move?
- Where is my stop-loss or invalidation level?
- Is the potential reward at least reasonable compared with the risk?
- What news or event could make the pattern unreliable?
- Have I written the plan before entering?
14. Candlestick Pattern Myths: What to Stop Believing
- Myth: More patterns mean better trading. Reality: A few patterns used well are better than dozens memorized poorly.
- Myth: A pattern works the same everywhere. Reality: Market, time frame, liquidity, and volatility change the signal quality.
- Myth: A textbook pattern is enough. Reality: Real charts are messy, and confirmation matters.
- Myth: Candlesticks predict the future. Reality: They describe current and recent behavior; the future remains uncertain.
- Myth: Bigger leverage means bigger opportunity. Reality: Leverage can magnify losses quickly.
15. Frequently Asked Questions
1. What is the easiest candlestick pattern for beginners?
The doji, hammer, shooting star, bullish engulfing, and bearish engulfing patterns are usually the easiest to learn. Start with the story behind each pattern rather than memorizing rare names.
2. Which candlestick pattern is most reliable?
No pattern is always reliable. Patterns tend to be more useful when they appear at meaningful support or resistance, match the broader trend context, and receive confirmation.
3. Can candlestick patterns make me profitable?
Candlestick patterns alone do not guarantee profit. Trading outcomes depend on risk management, emotional control, market conditions, fees, execution, and whether the strategy has been tested.
4. Are candlestick patterns good for day trading?
They can be used by day traders, but lower time frames are noisier and faster. Beginners often learn more clearly from daily or four-hour charts before moving to very short-term trading.
5. Should I use candlesticks for investing?
Long-term investors may use candlesticks to time entries or understand short-term sentiment, but investment decisions should also consider fundamentals, valuation, diversification, and personal financial goals.
6. What is the best way to practice?
Use historical charts, replay features, or a demo account. Pick one or two patterns, write rules, record screenshots, and review results honestly.
■ Conclusion: Learn the Story, Not Just the Shape
Candlestick patterns are useful because they turn price movement into a readable story. A hammer may show rejection of lower prices. A shooting star may show rejection of higher prices. An engulfing pattern may show a shift in control. But the pattern is only the beginning. The real skill is asking where it happened, why it matters, whether it was confirmed, and how much risk is involved.
For beginners, the best path is simple: learn the basic candle parts, practice a few common patterns, study them at support and resistance, and keep a trading journal. Candlestick patterns can improve chart reading, but they should be used with patience, risk management, and honest expectations.
Sources and References
- U.S. Securities and Exchange Commission: Day Trading: Your Dollars at Risk - used for risk-aware language around active trading.
- Investor.gov: Extended-Hours Trading Investor Bulletin - used for liquidity and trading-risk context.
- Charles Schwab: How to Read Stock Charts and Trading Patterns - used for beginner chart-reading framing.
- Investopedia: Candlestick pattern education pages - used as general cross-checking for standard pattern definitions.